Self-hosted · Open source

Your whole net worth. One honest number.

A budget and portfolio tracker for everything you own, from cash and bonds to gold and Bitcoin. Everything is valued live in a single currency, it shows what you really spend, and a private AI analyst on your own GPU reviews it all.

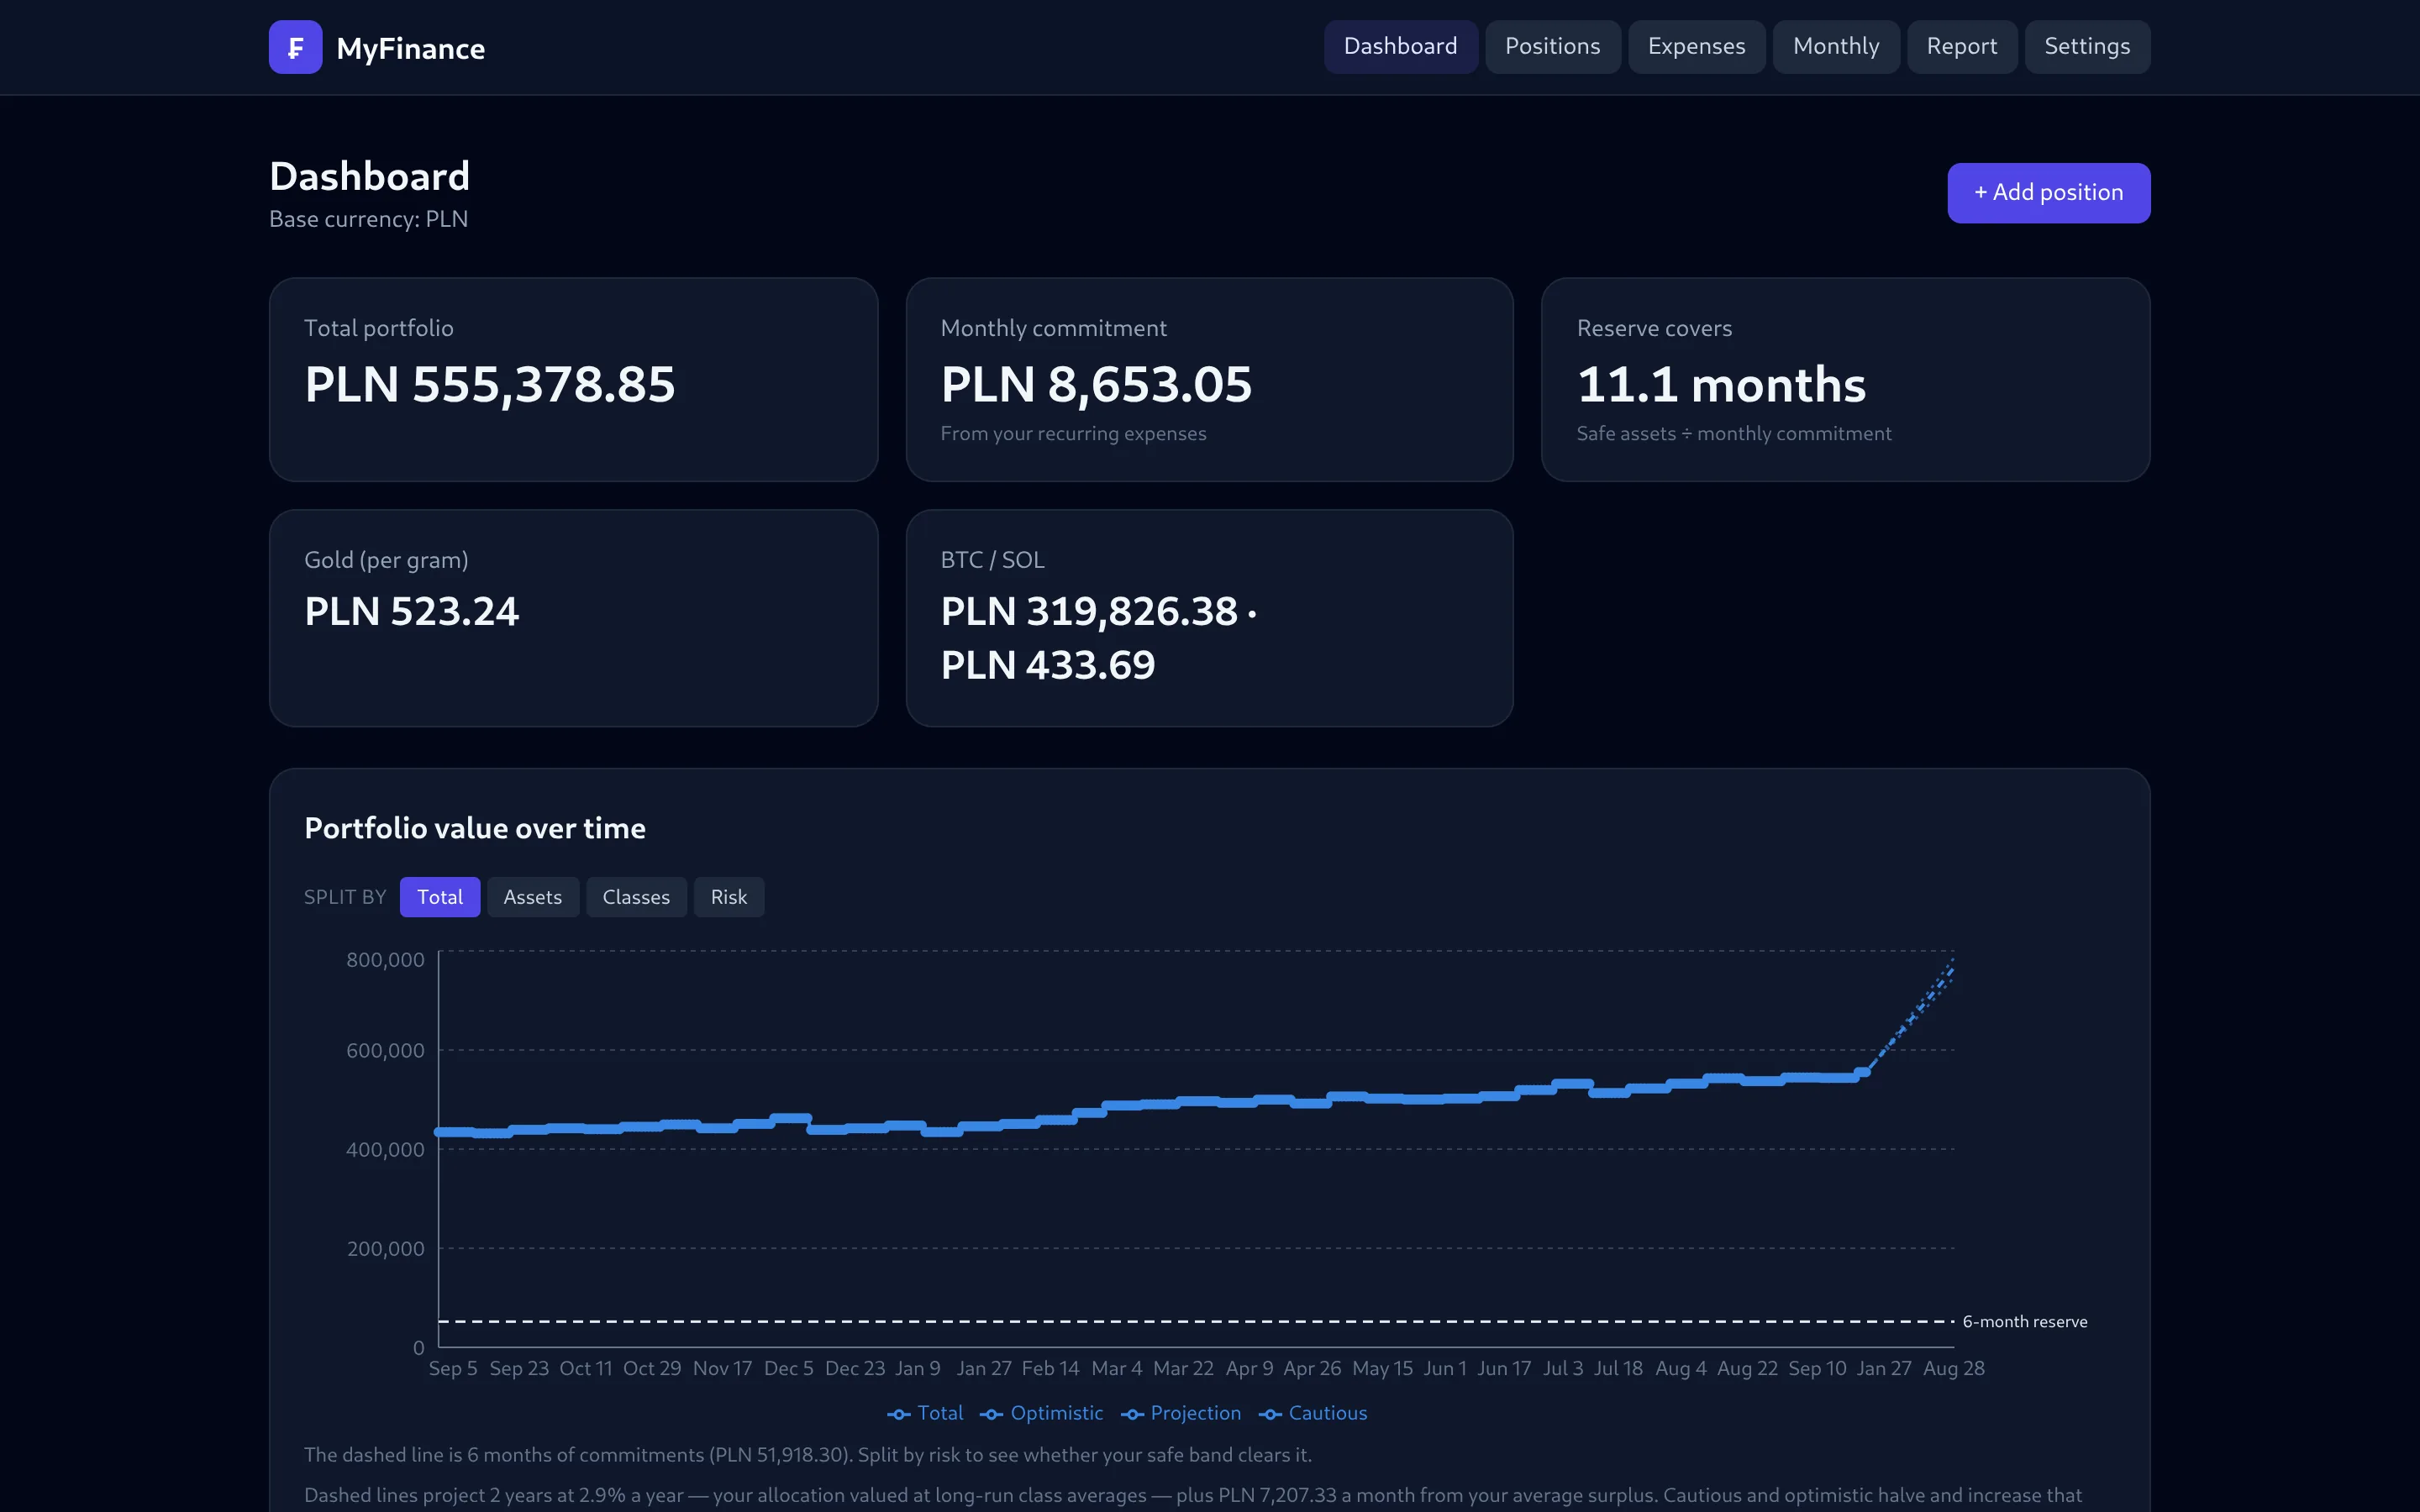
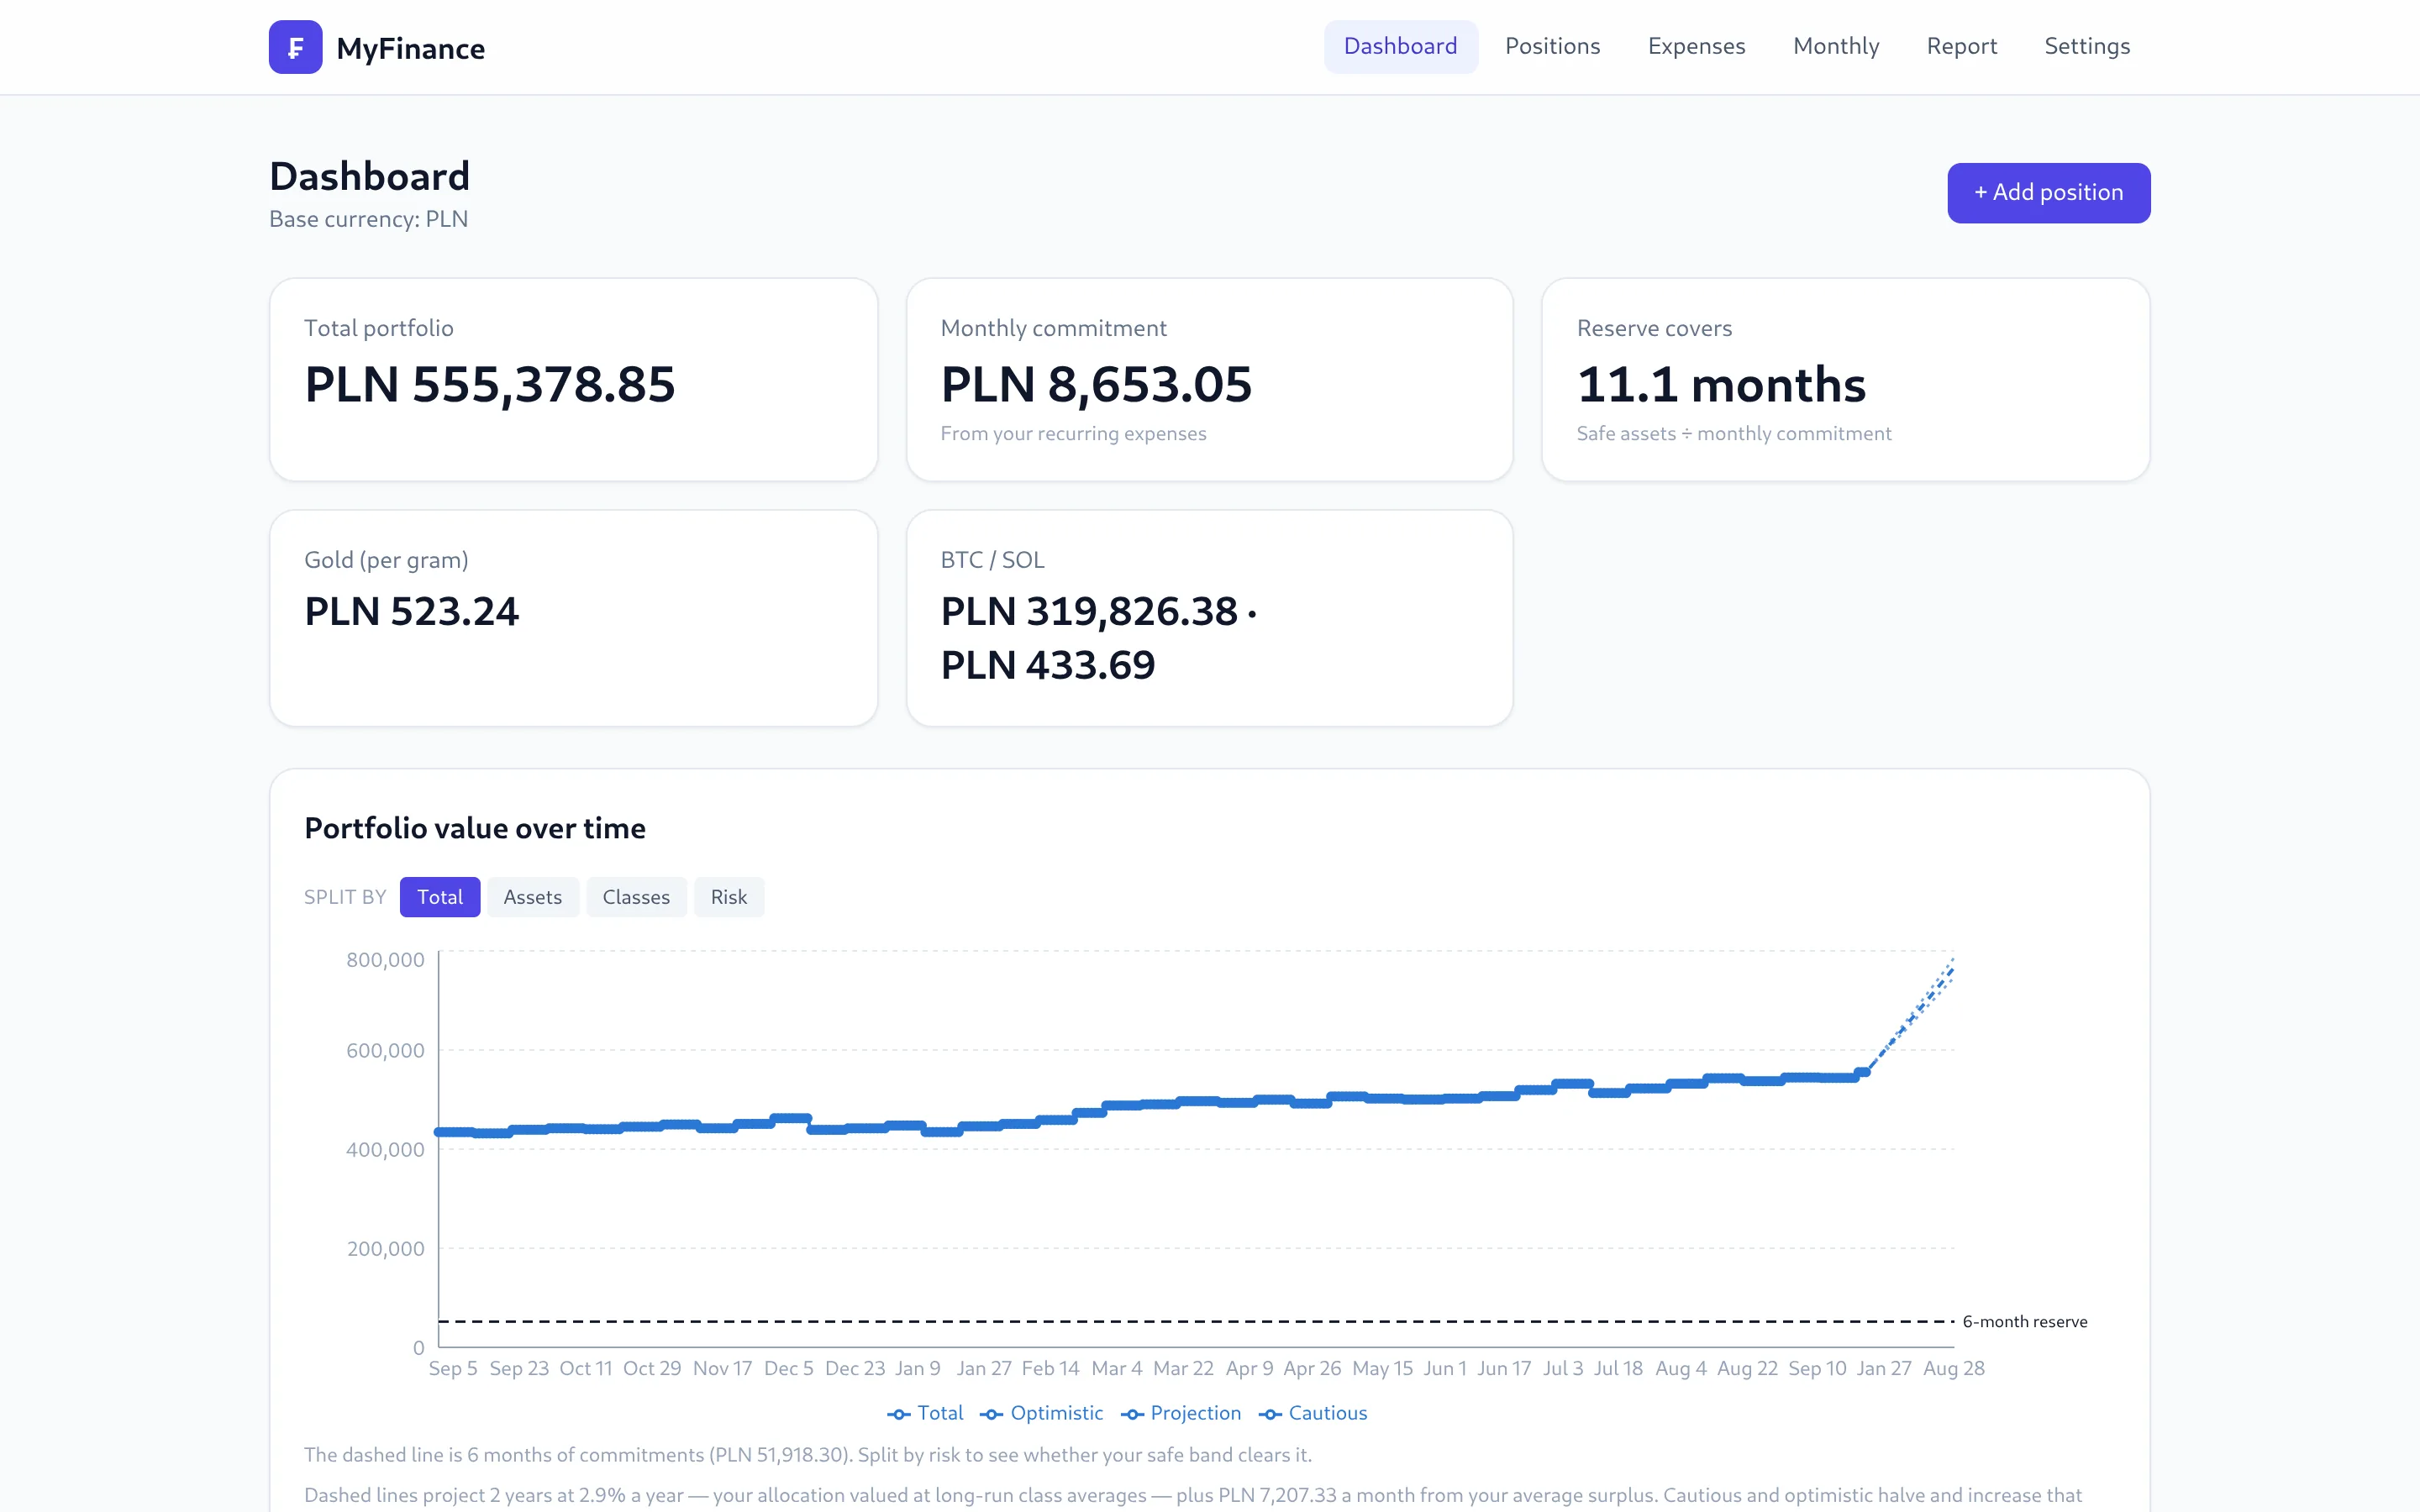
MyFinance dashboard: total portfolio, monthly commitment, reserve cover, and live gold and crypto prices

The problem

Your money lives in a dozen places, so three simple questions go unanswered.

What am I worth today?

Cash in the bank, ETFs at a broker, coins on an exchange and gold in a safe, all in different units and currencies.

Where did the money go?

Budgets only catch what you remember to type in. The rest disappears quietly.

How much risk am I taking?

A market drawdown and an illiquid watch collection are different risks, and a spreadsheet treats them the same.

Positions

Track each asset in its real unit

Enter gold in grams and crypto in coins. MyFinance fetches live prices and converts everything into your base currency.

Cash, savings, bondsPLN, EUR, USD or CHF
Goldgrams, at the live price per gram
Bitcoin, Solanacoin quantity, priced live
Stocks, funds, pensionsvalue in any currency
Watches, vehiclesrevalue whenever you like

Every update is timestamped, so your history builds itself.
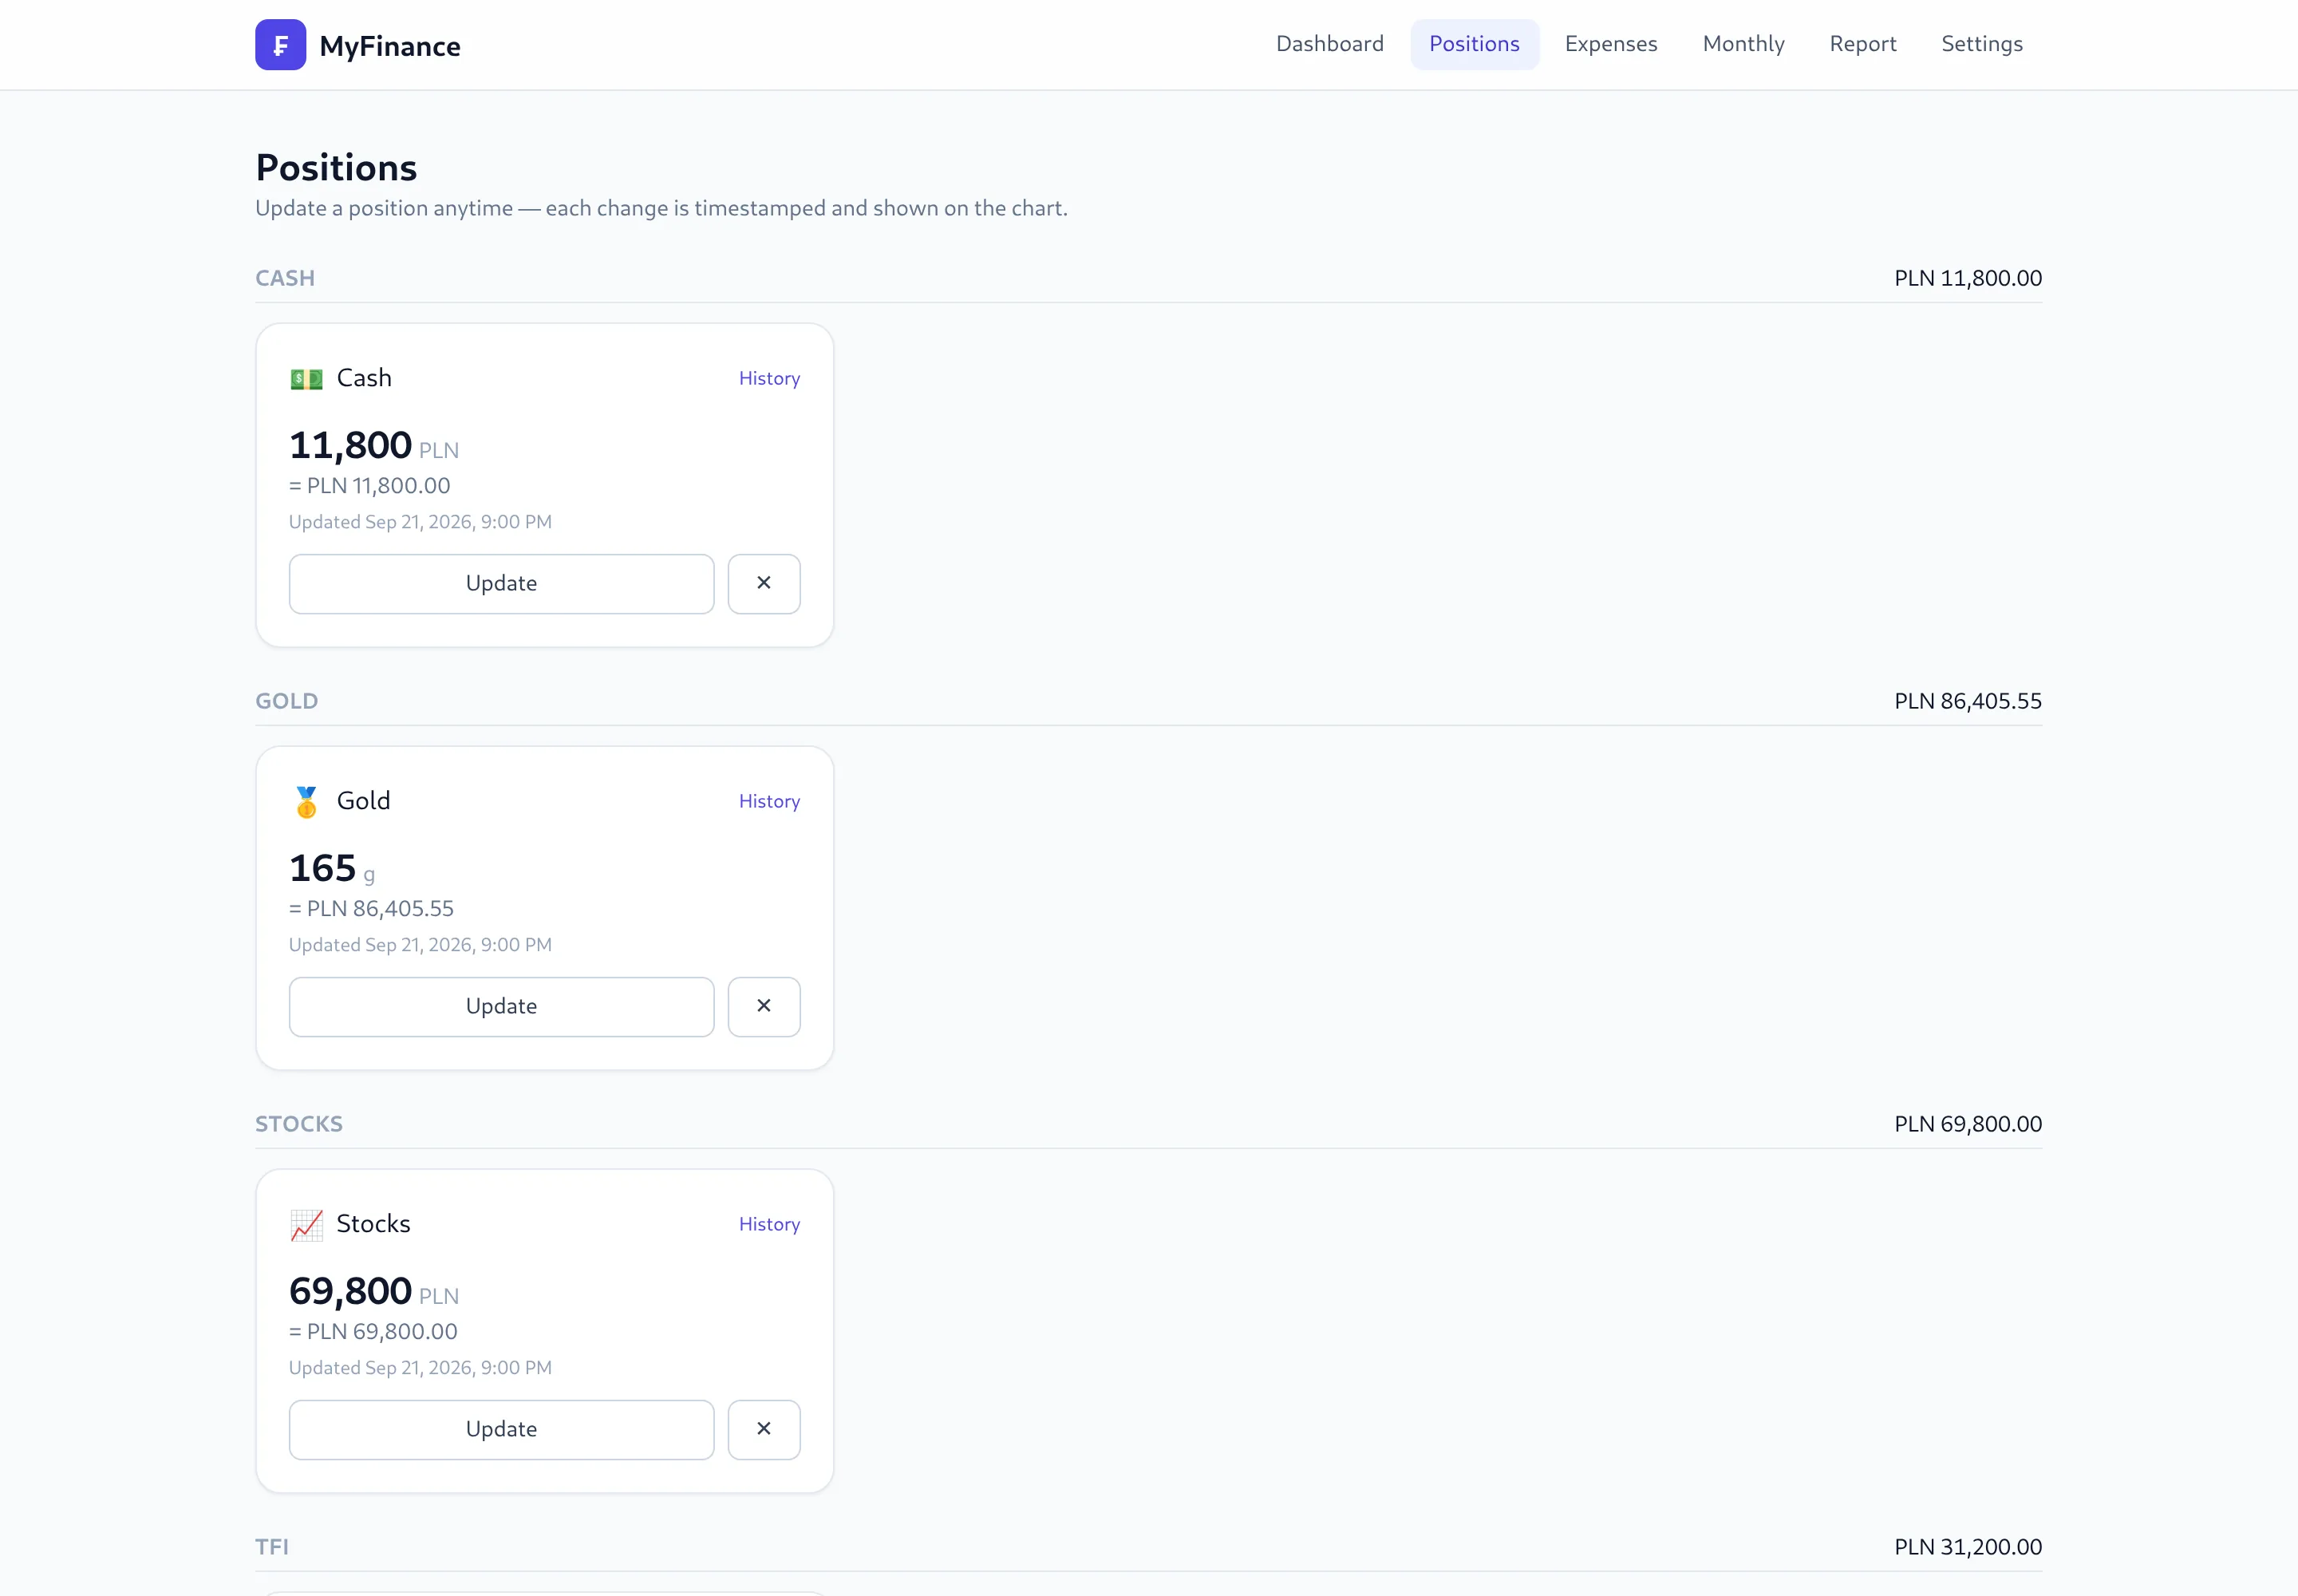
Positions page listing cash, gold in grams, stocks, funds and bonds, each with Update and History

History

See how the portfolio grew, and what drove it

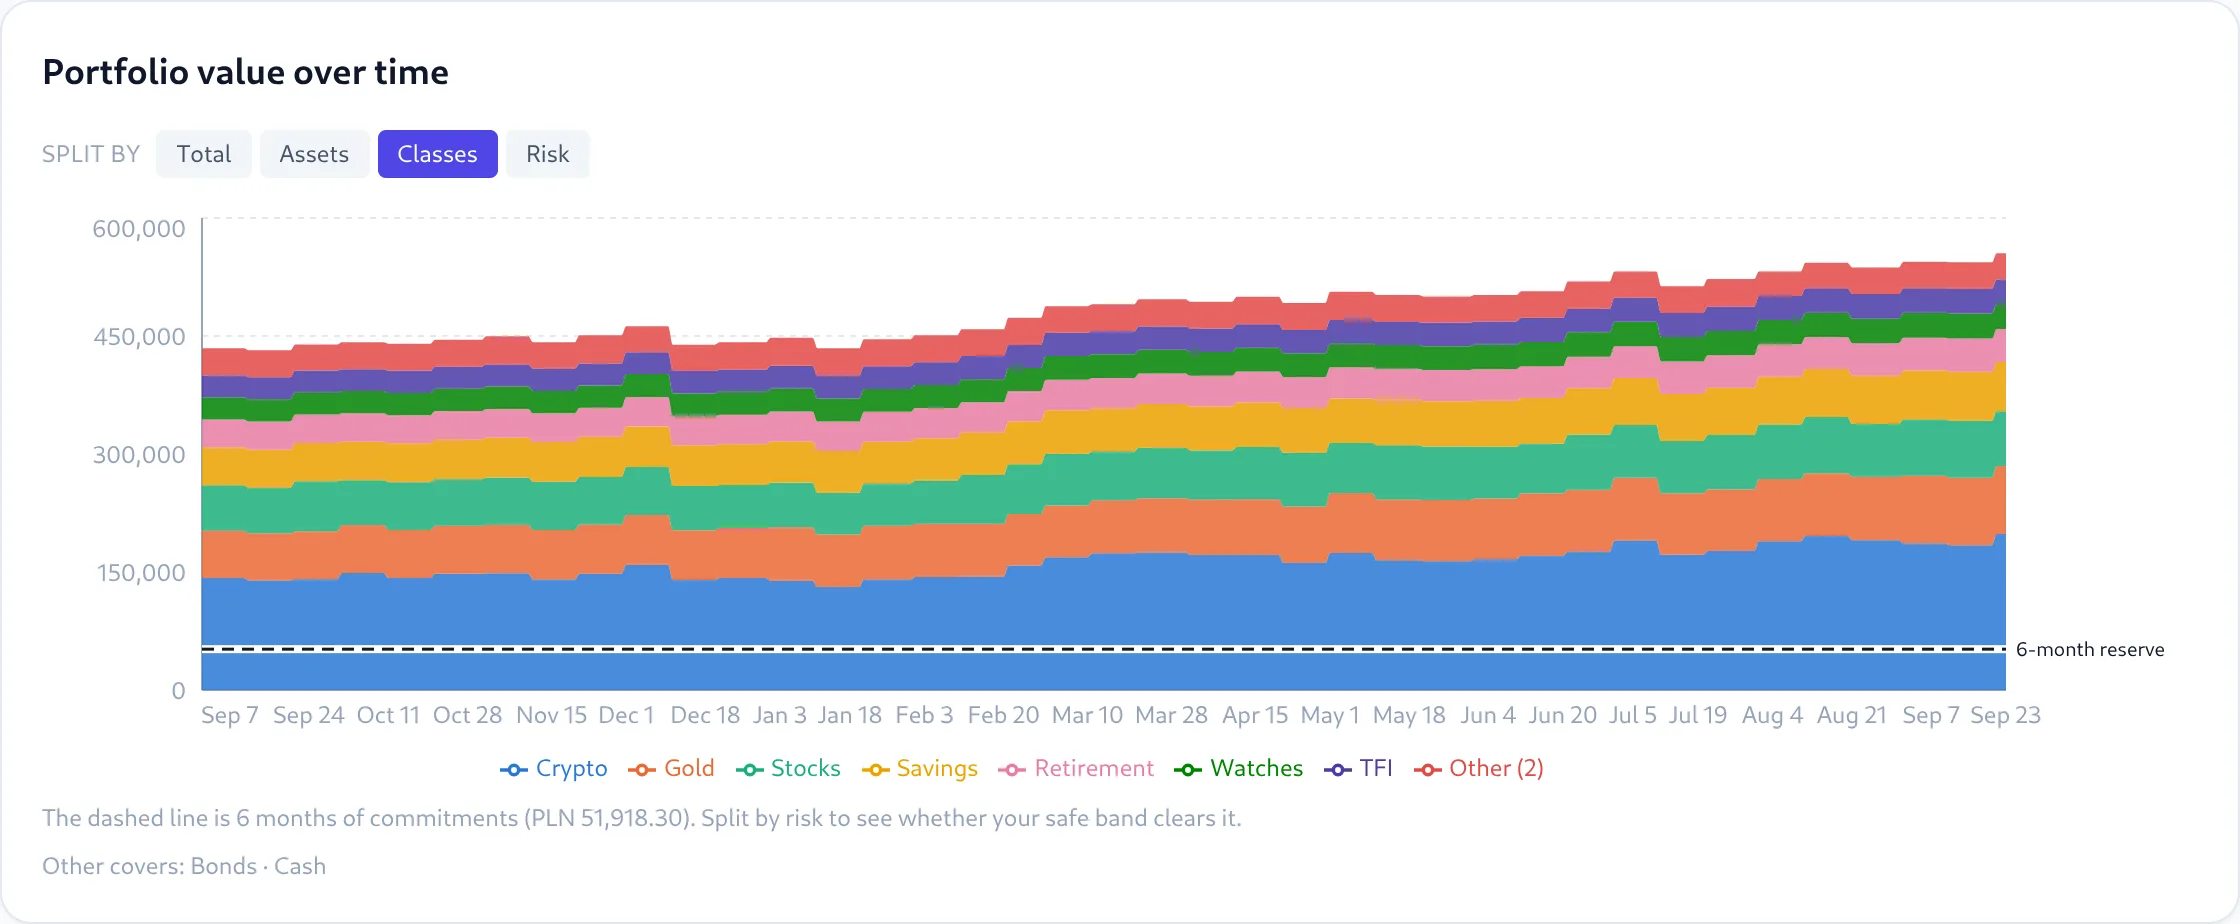
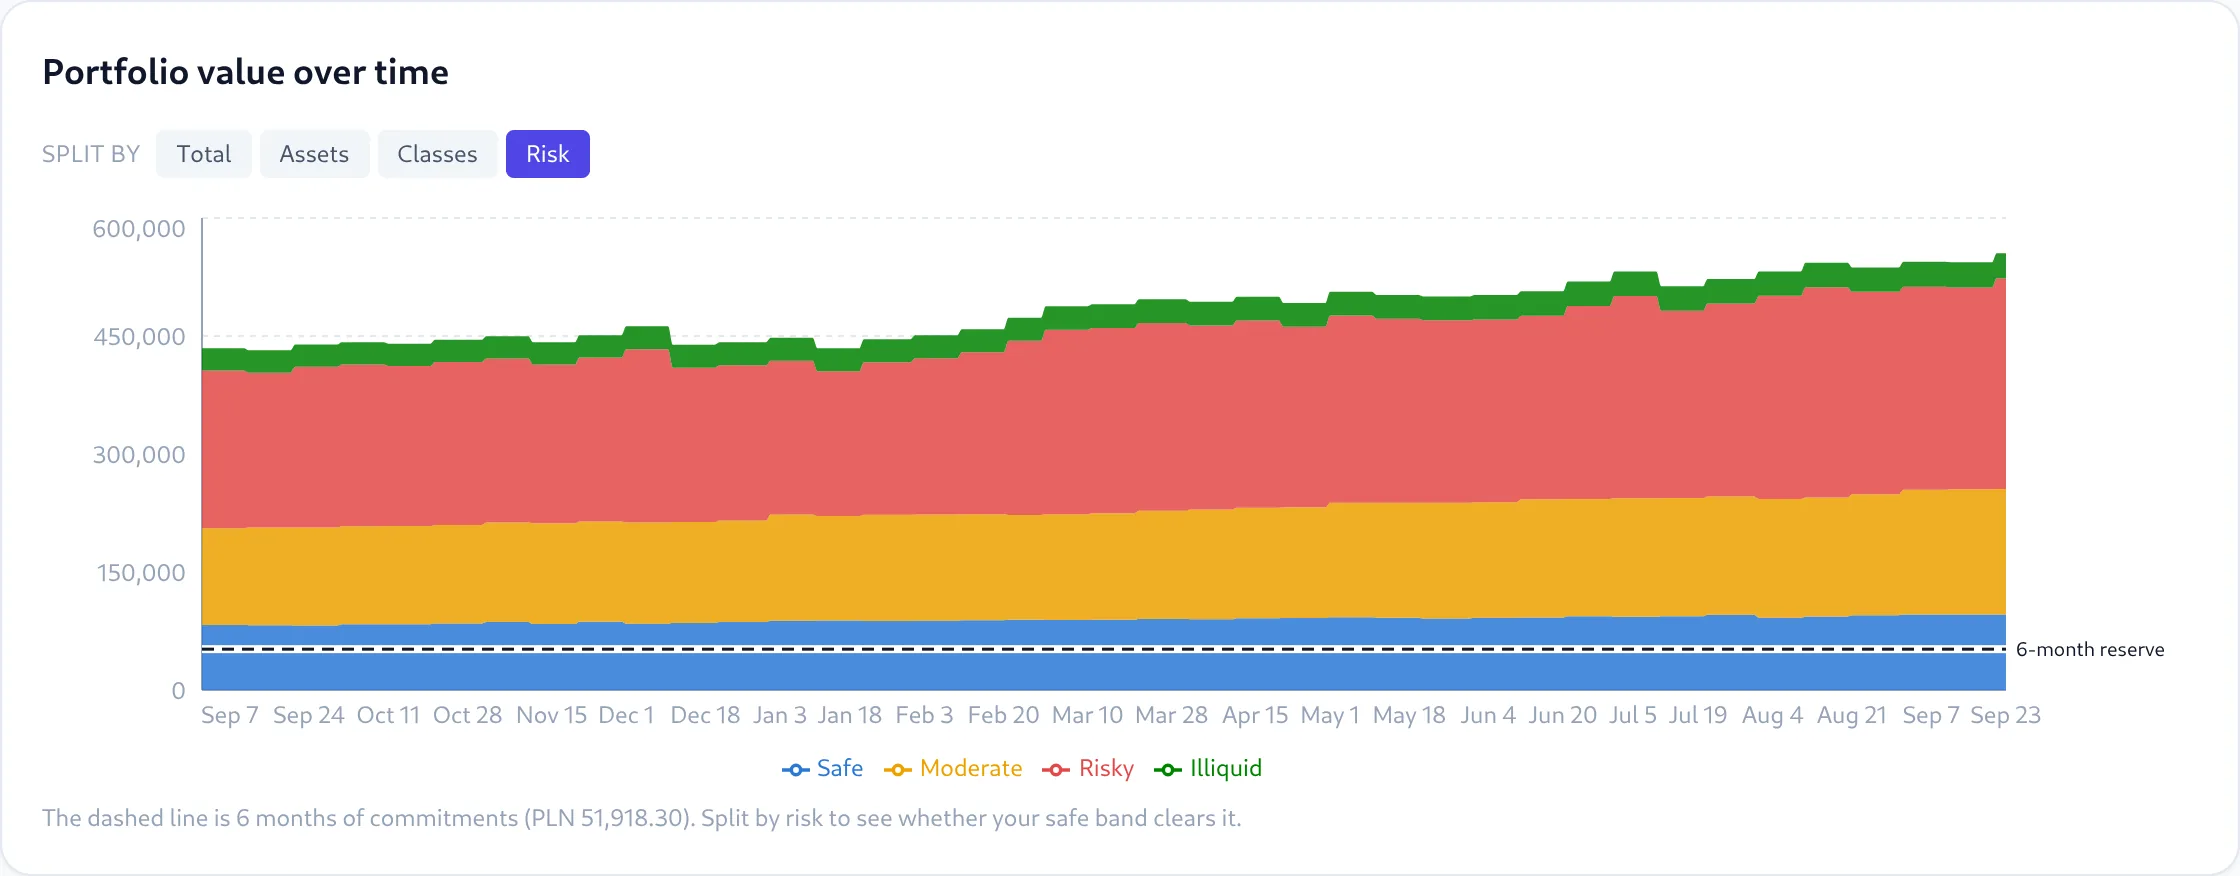
One chart, four views: total, per asset, per class and per risk band. Past points keep the prices of their own day, so you see what actually happened rather than today's prices applied to last year.

  • Projection with cautious and optimistic scenarios
  • Six-month reserve line drawn on the chart
Stacked area chart of portfolio value over a year, split by asset class
Stacked area chart of portfolio value split by risk band

Risk profile

Know how exposed you really are

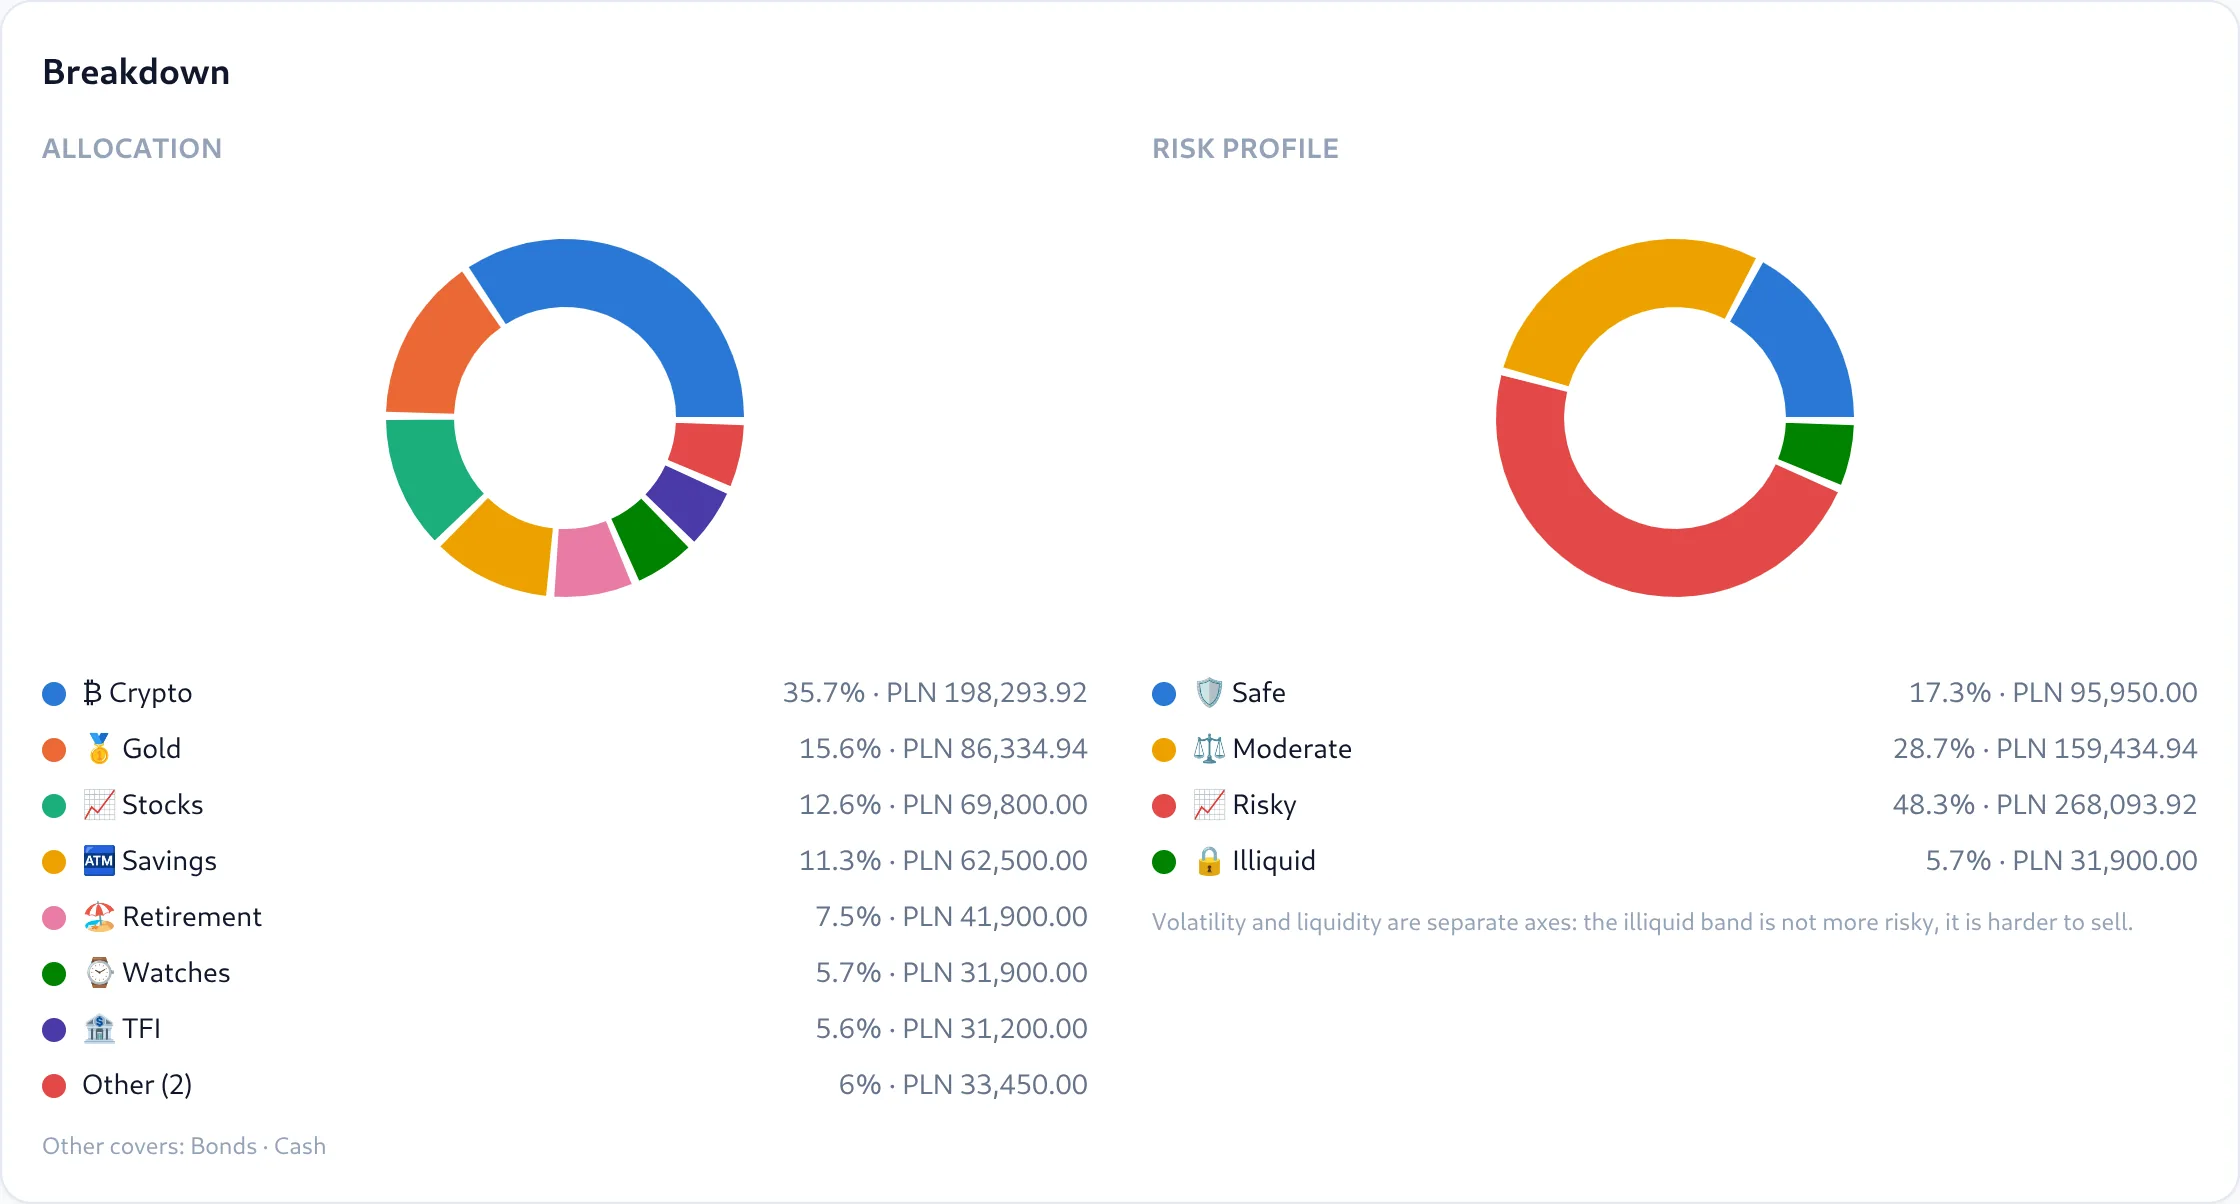
Allocation tells you what you hold. The risk profile tells you how exposed you are and how quickly you could get your money out.

Safecash, savings, bonds: available tomorrow
Moderatefunds, gold, retirement
Riskystocks, crypto: can fall sharply
Illiquidwatches, vehicles, receivables: slow to sell
Allocation and risk-profile donut charts with the percentage for each class and band

Two axes, not one

Volatility and liquidity are measured separately. A watch collection won't crash, but it can't pay next month's rent either, so it gets its own band instead of inflating "risky".

Your safety net comes from it

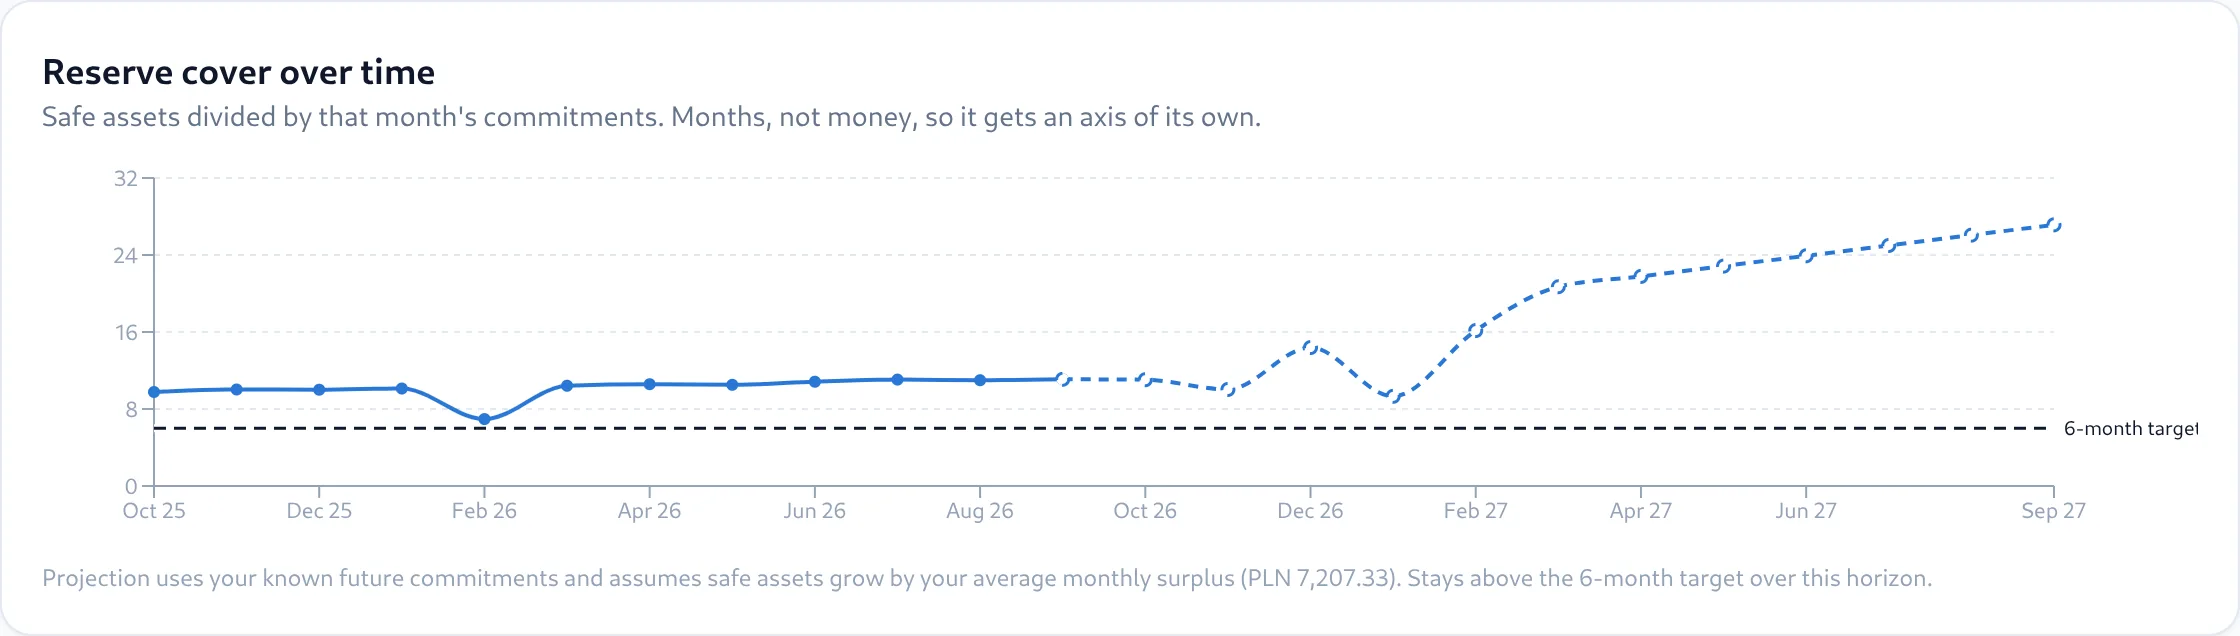
Reserve cover counts only the safe band against your monthly commitments. Split the value chart by risk to see whether that band stays above the six-month line.

Each asset has its own band

Every asset starts in its class's band but keeps its own, so one holding can be classed differently from the rest. The AI review is told the bands too.

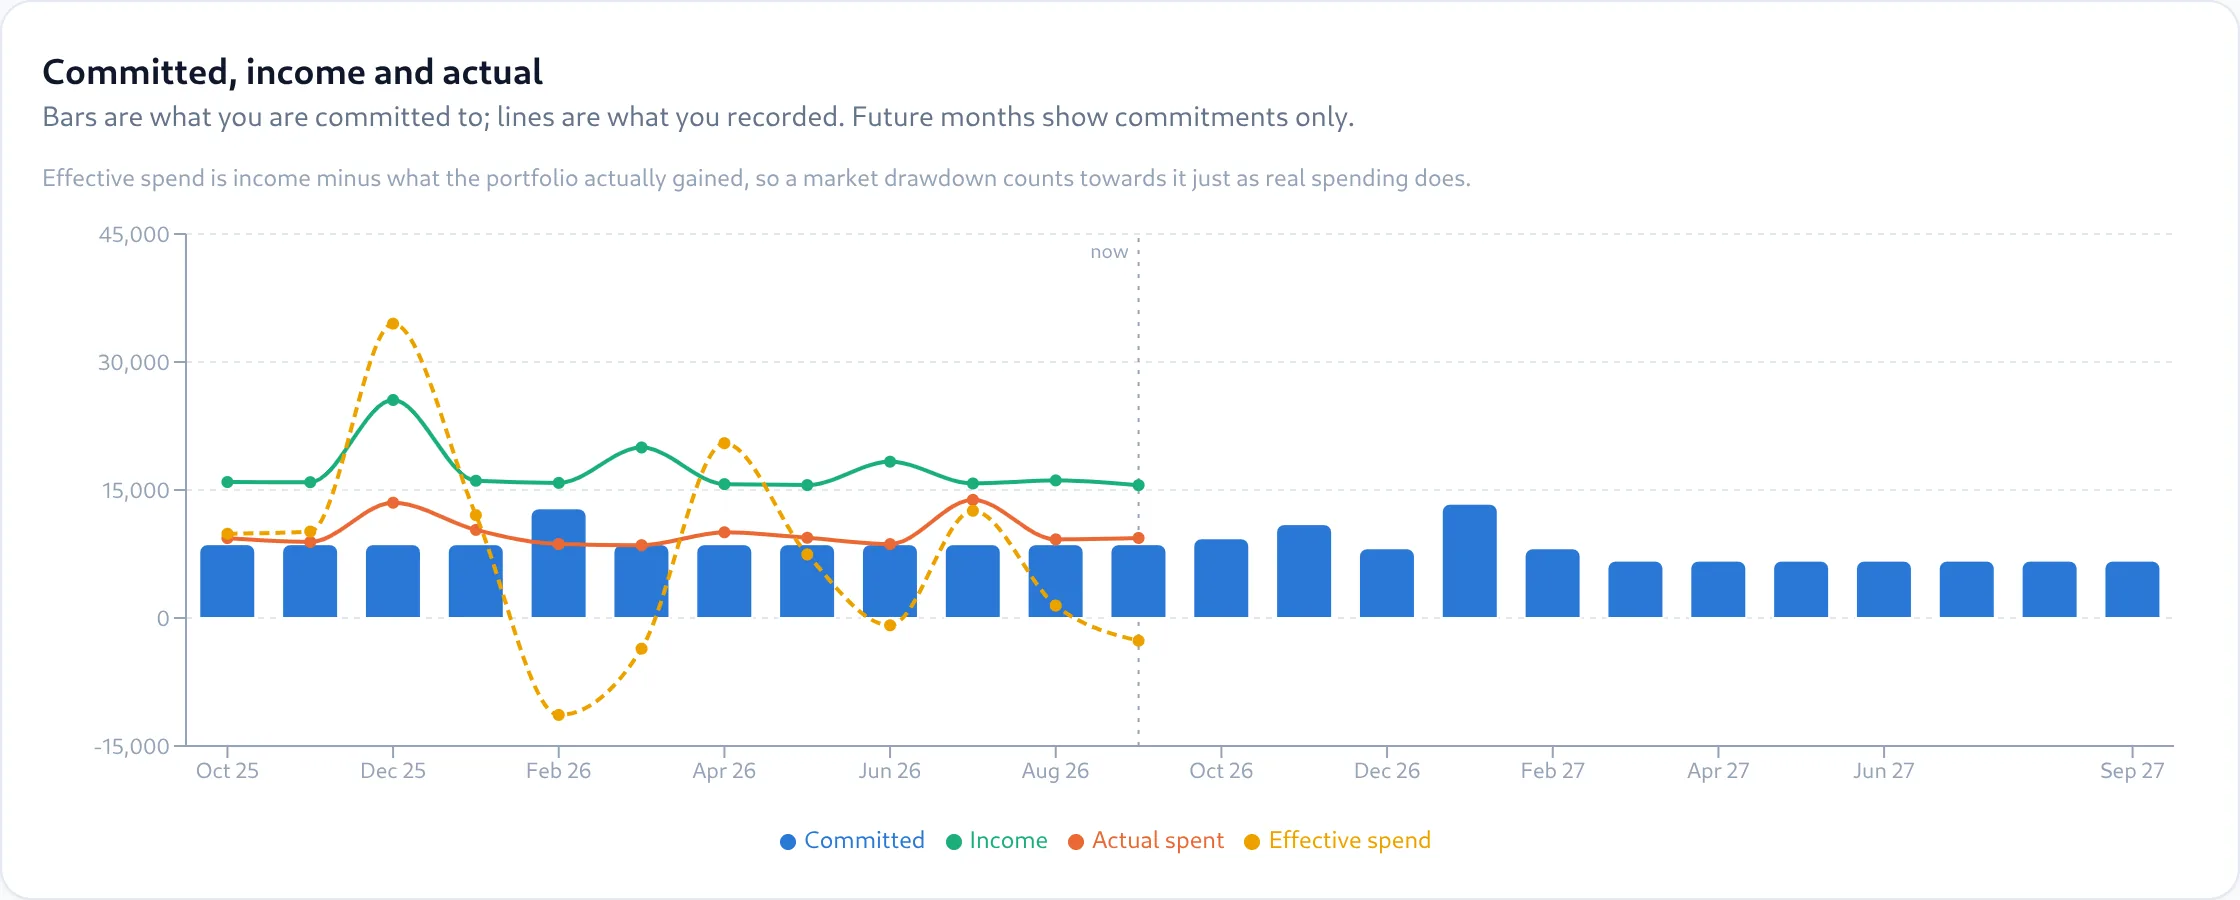
Effective spend

effective spend =
income − change in net worth

Everything you earn either ends up in your portfolio or gets spent. MyFinance works out your real spending from your net worth, including everything you forgot to log. It's honest about markets too: a drawdown counts in the month it happens, and the app tells you so.

Monthly

Monthly budgets you never have to retype

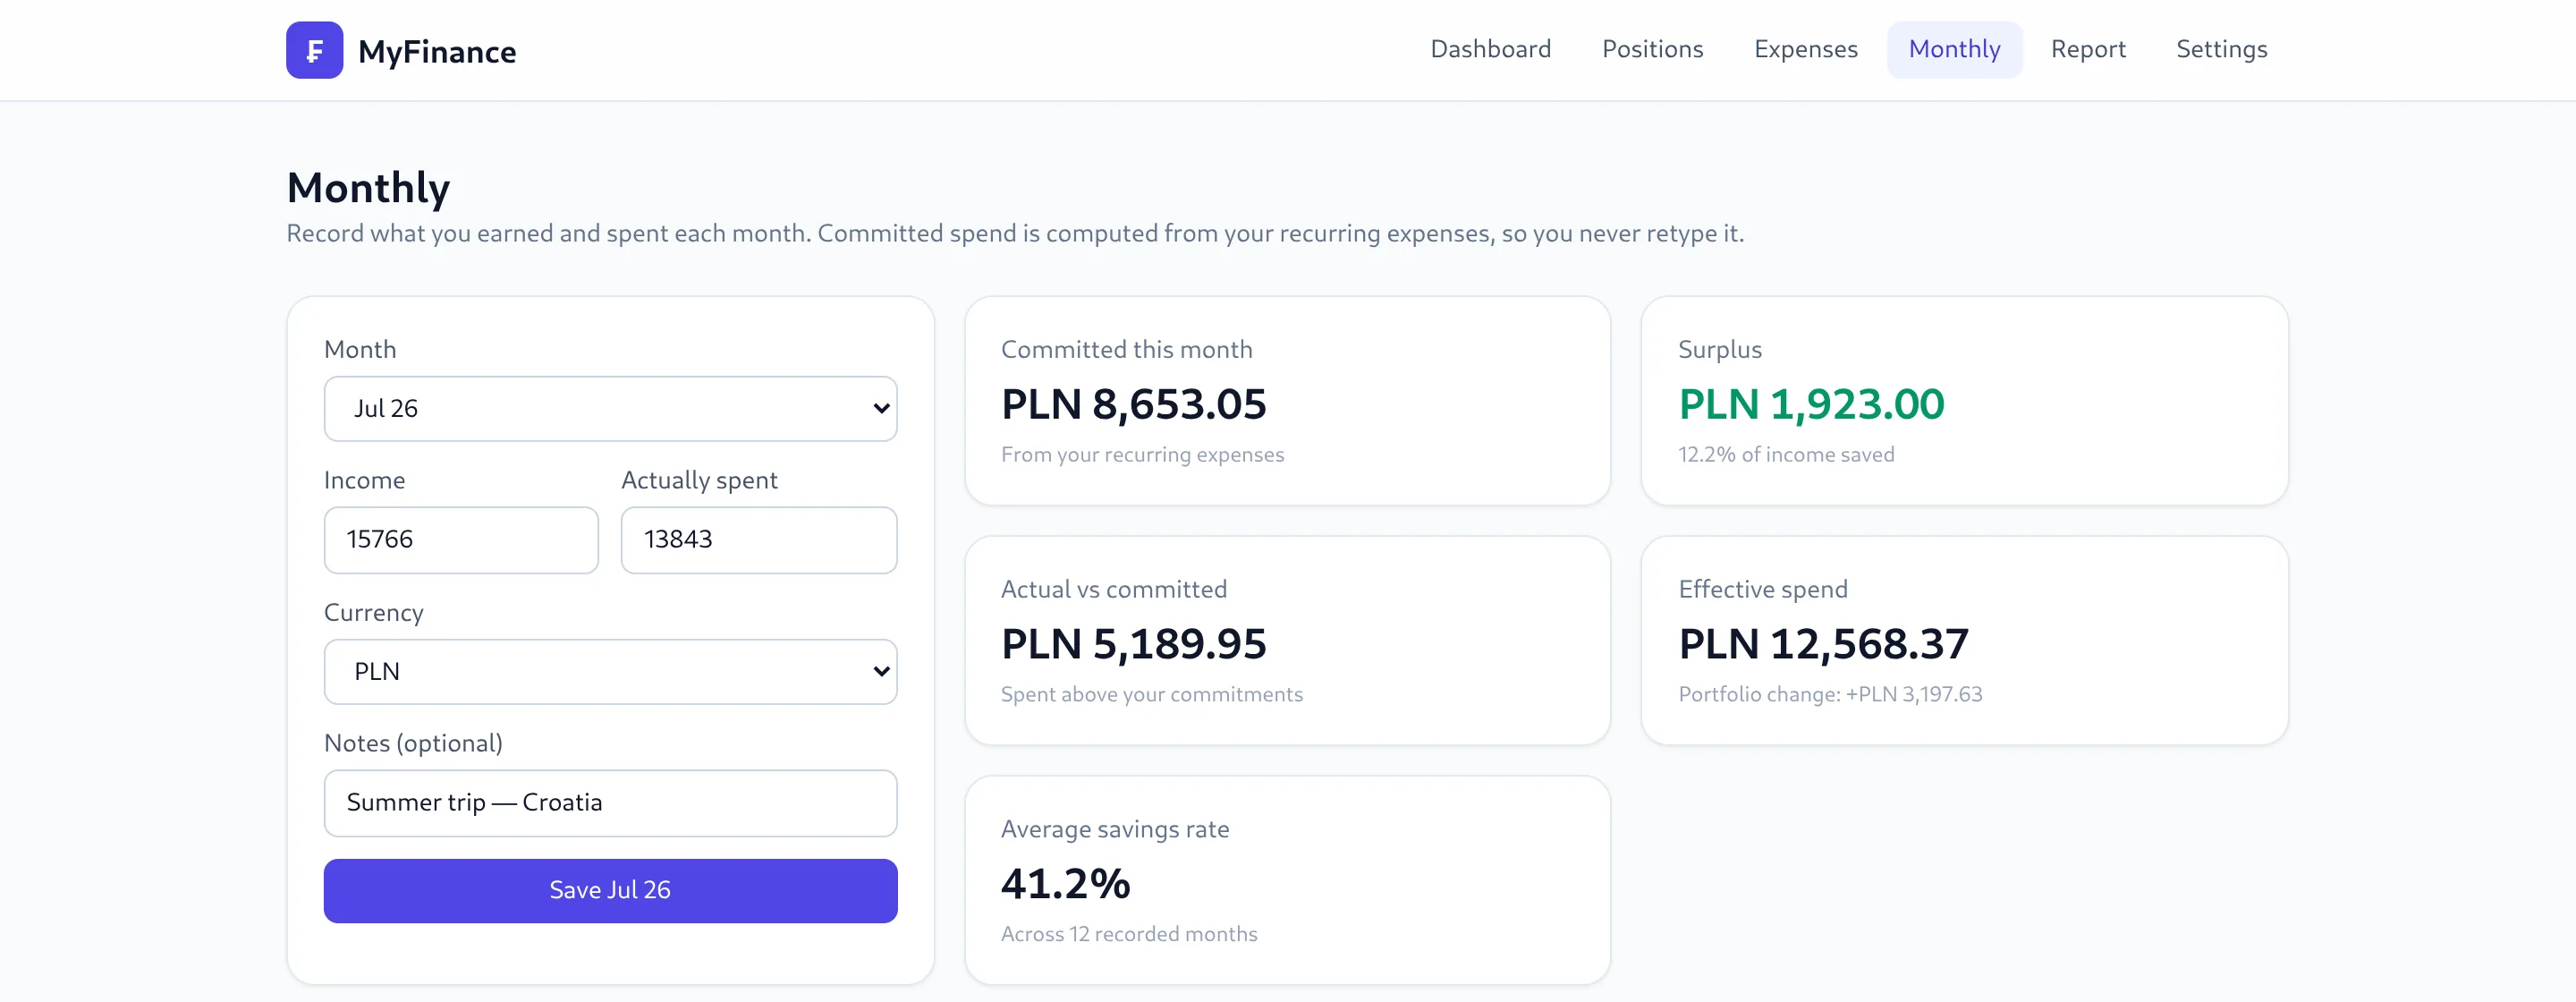
Record income and spend once a month. Committed spend comes from your recurring expenses, so fixing an expense also corrects every past month it applies to.

  • Savings rate and surplus for every month
  • Typed-in spend next to effective spend
  • Commitments broken down by category
Monthly page for July 2026 showing income, actual spend, committed spend, surplus and effective spend
Chart comparing committed, income, actual and effective spend over two years

Expenses & reserve

Plan for what you've already committed to

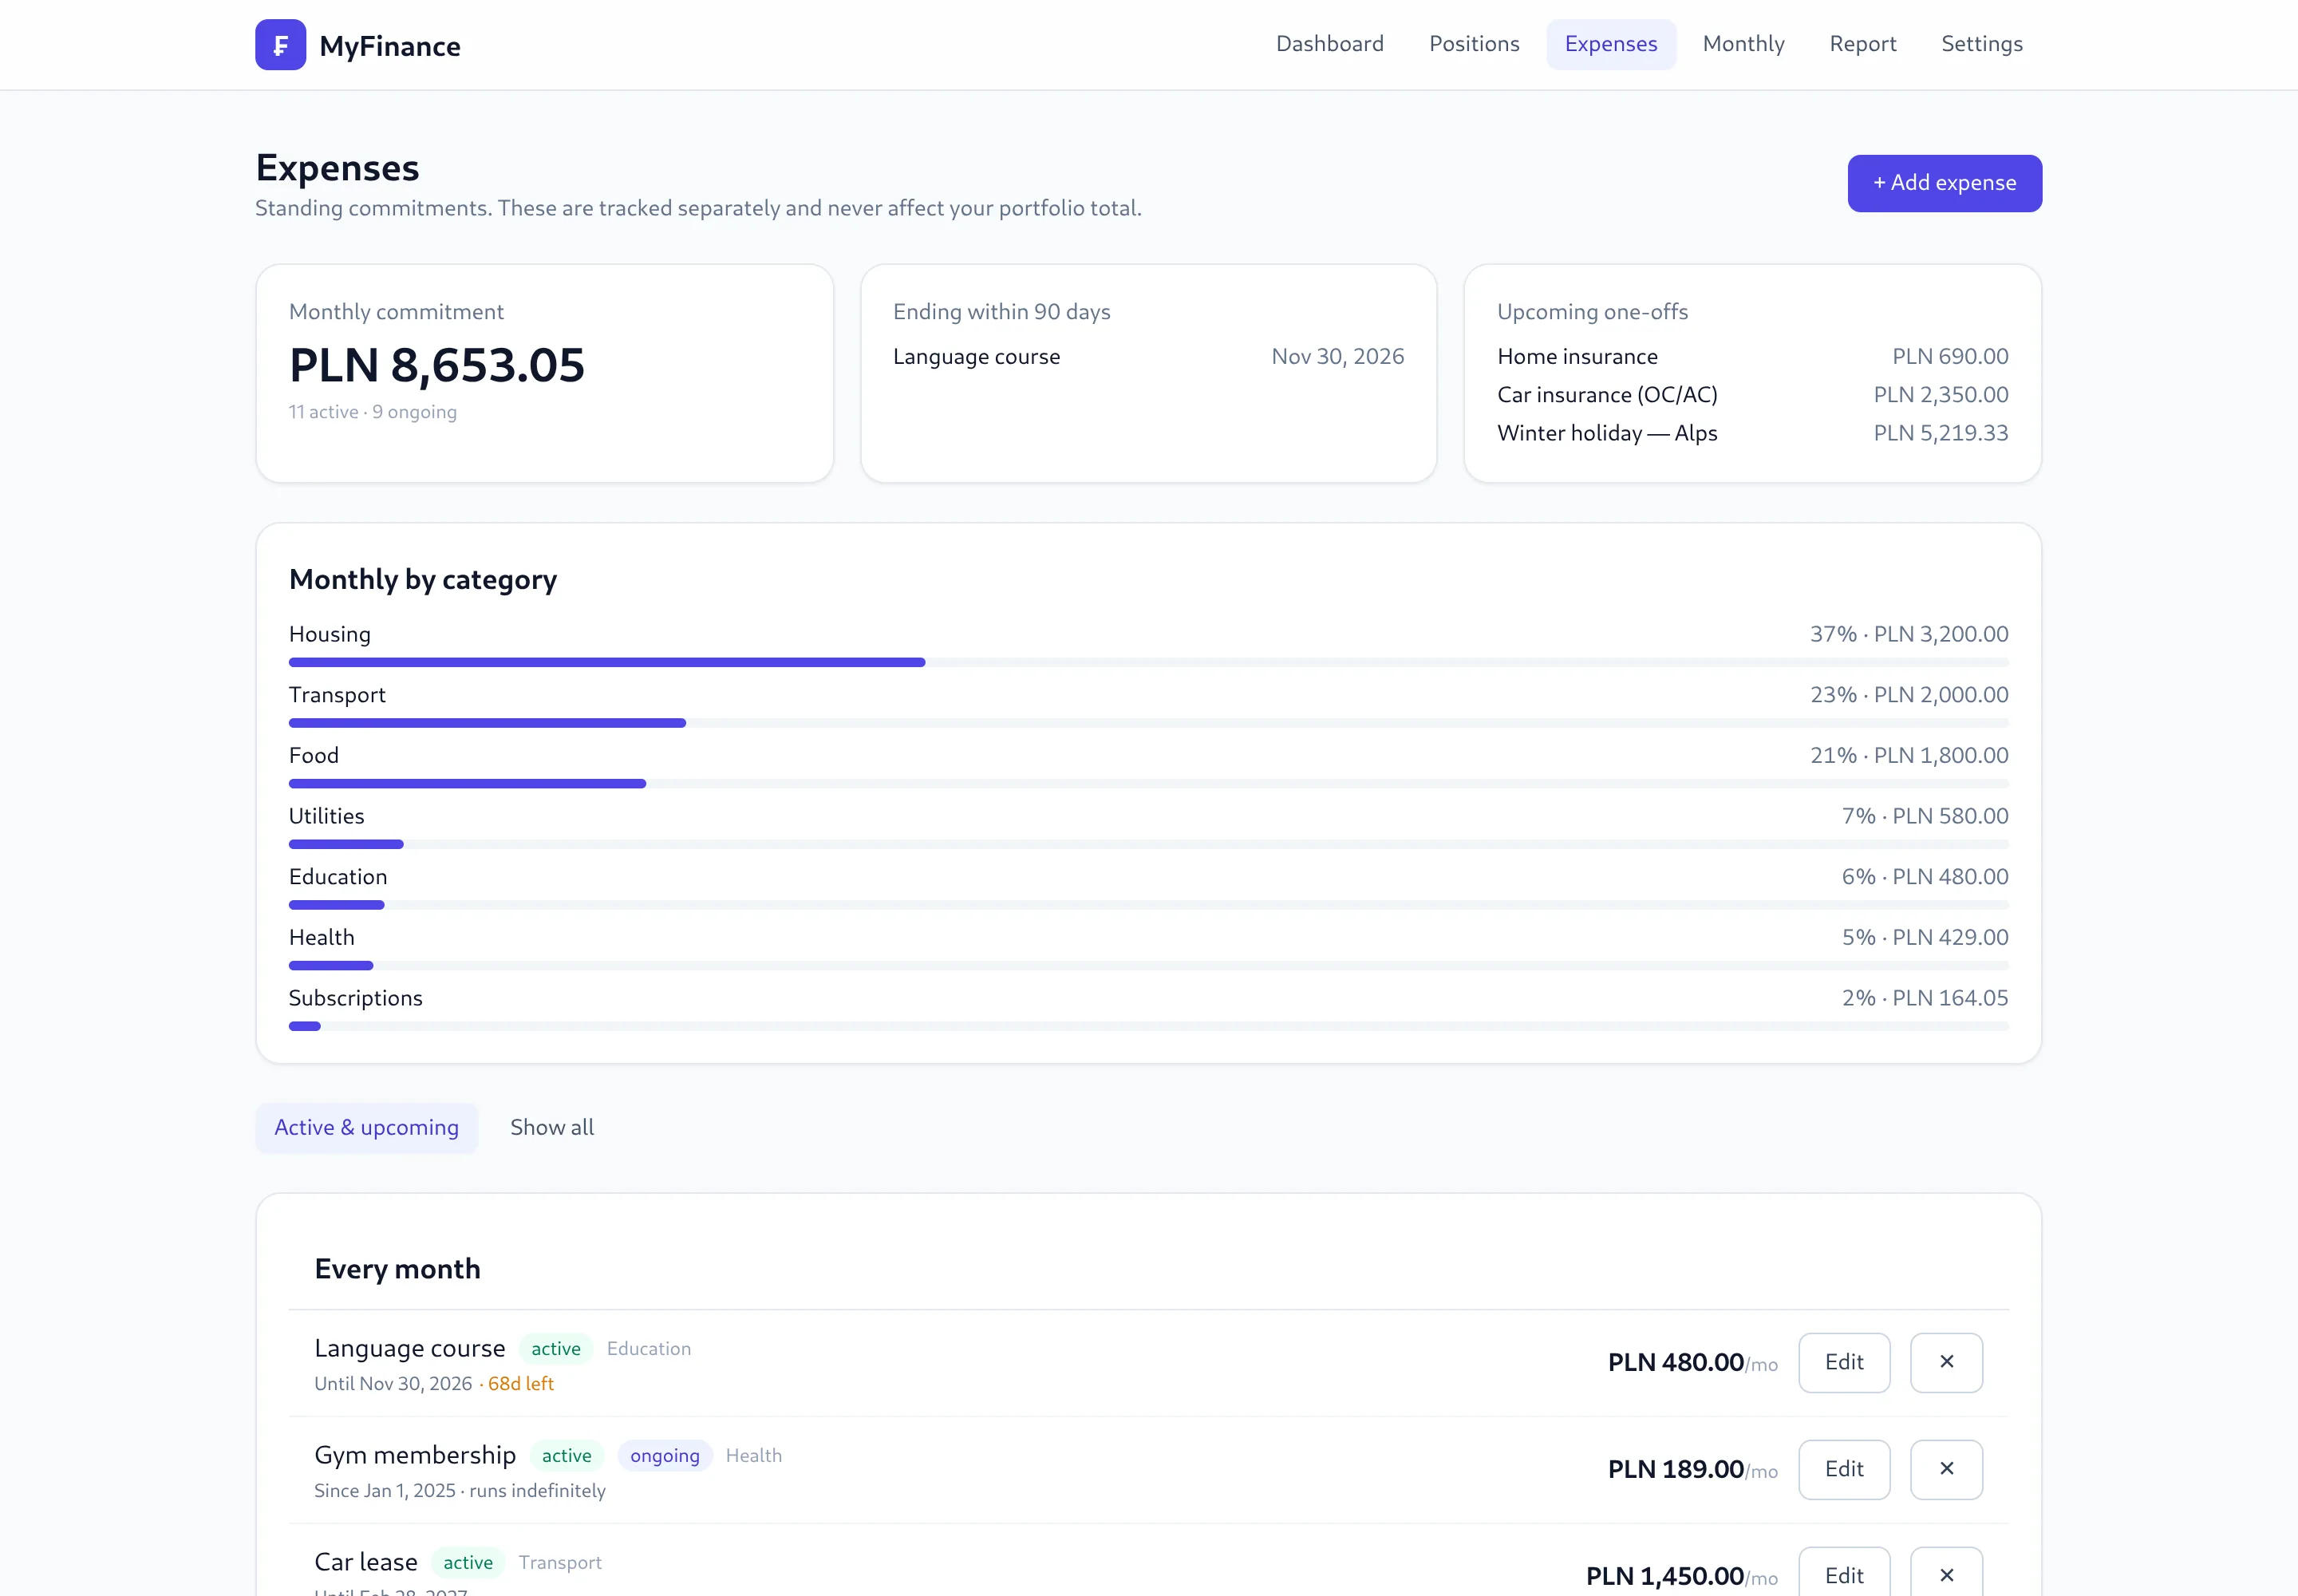
  • Rent, leases, subscriptions and one-off bills, in any currency
  • Upcoming payments and contracts ending soon are highlighted
  • Reserve cover projects how many months your safe assets last, including the bills already booked
Expenses page with the monthly commitment, a breakdown by category and the recurring expense list
Reserve cover over time, with a six-month target line and a dashed projection

AI inside

Your own AI financial analyst, running on your own GPU.

122Bparameters in the model that writes your review
4investing styles to judge your portfolio against
0figures sent to a cloud AI provider

Wallet assessment

A private portfolio review, on your own hardware

Tell it what kind of investor you want to be. A language model then checks what you actually hold against that goal and says plainly where the two differ.

  • Qwen3.5 122B writes the review; Bielik 11B translates it into natural Polish
  • The request goes to your own GPU server, not a cloud API
  • Runs in the background, since a large model takes minutes
  • Each report is stored with the figures it was based on, so an old review still makes sense months later
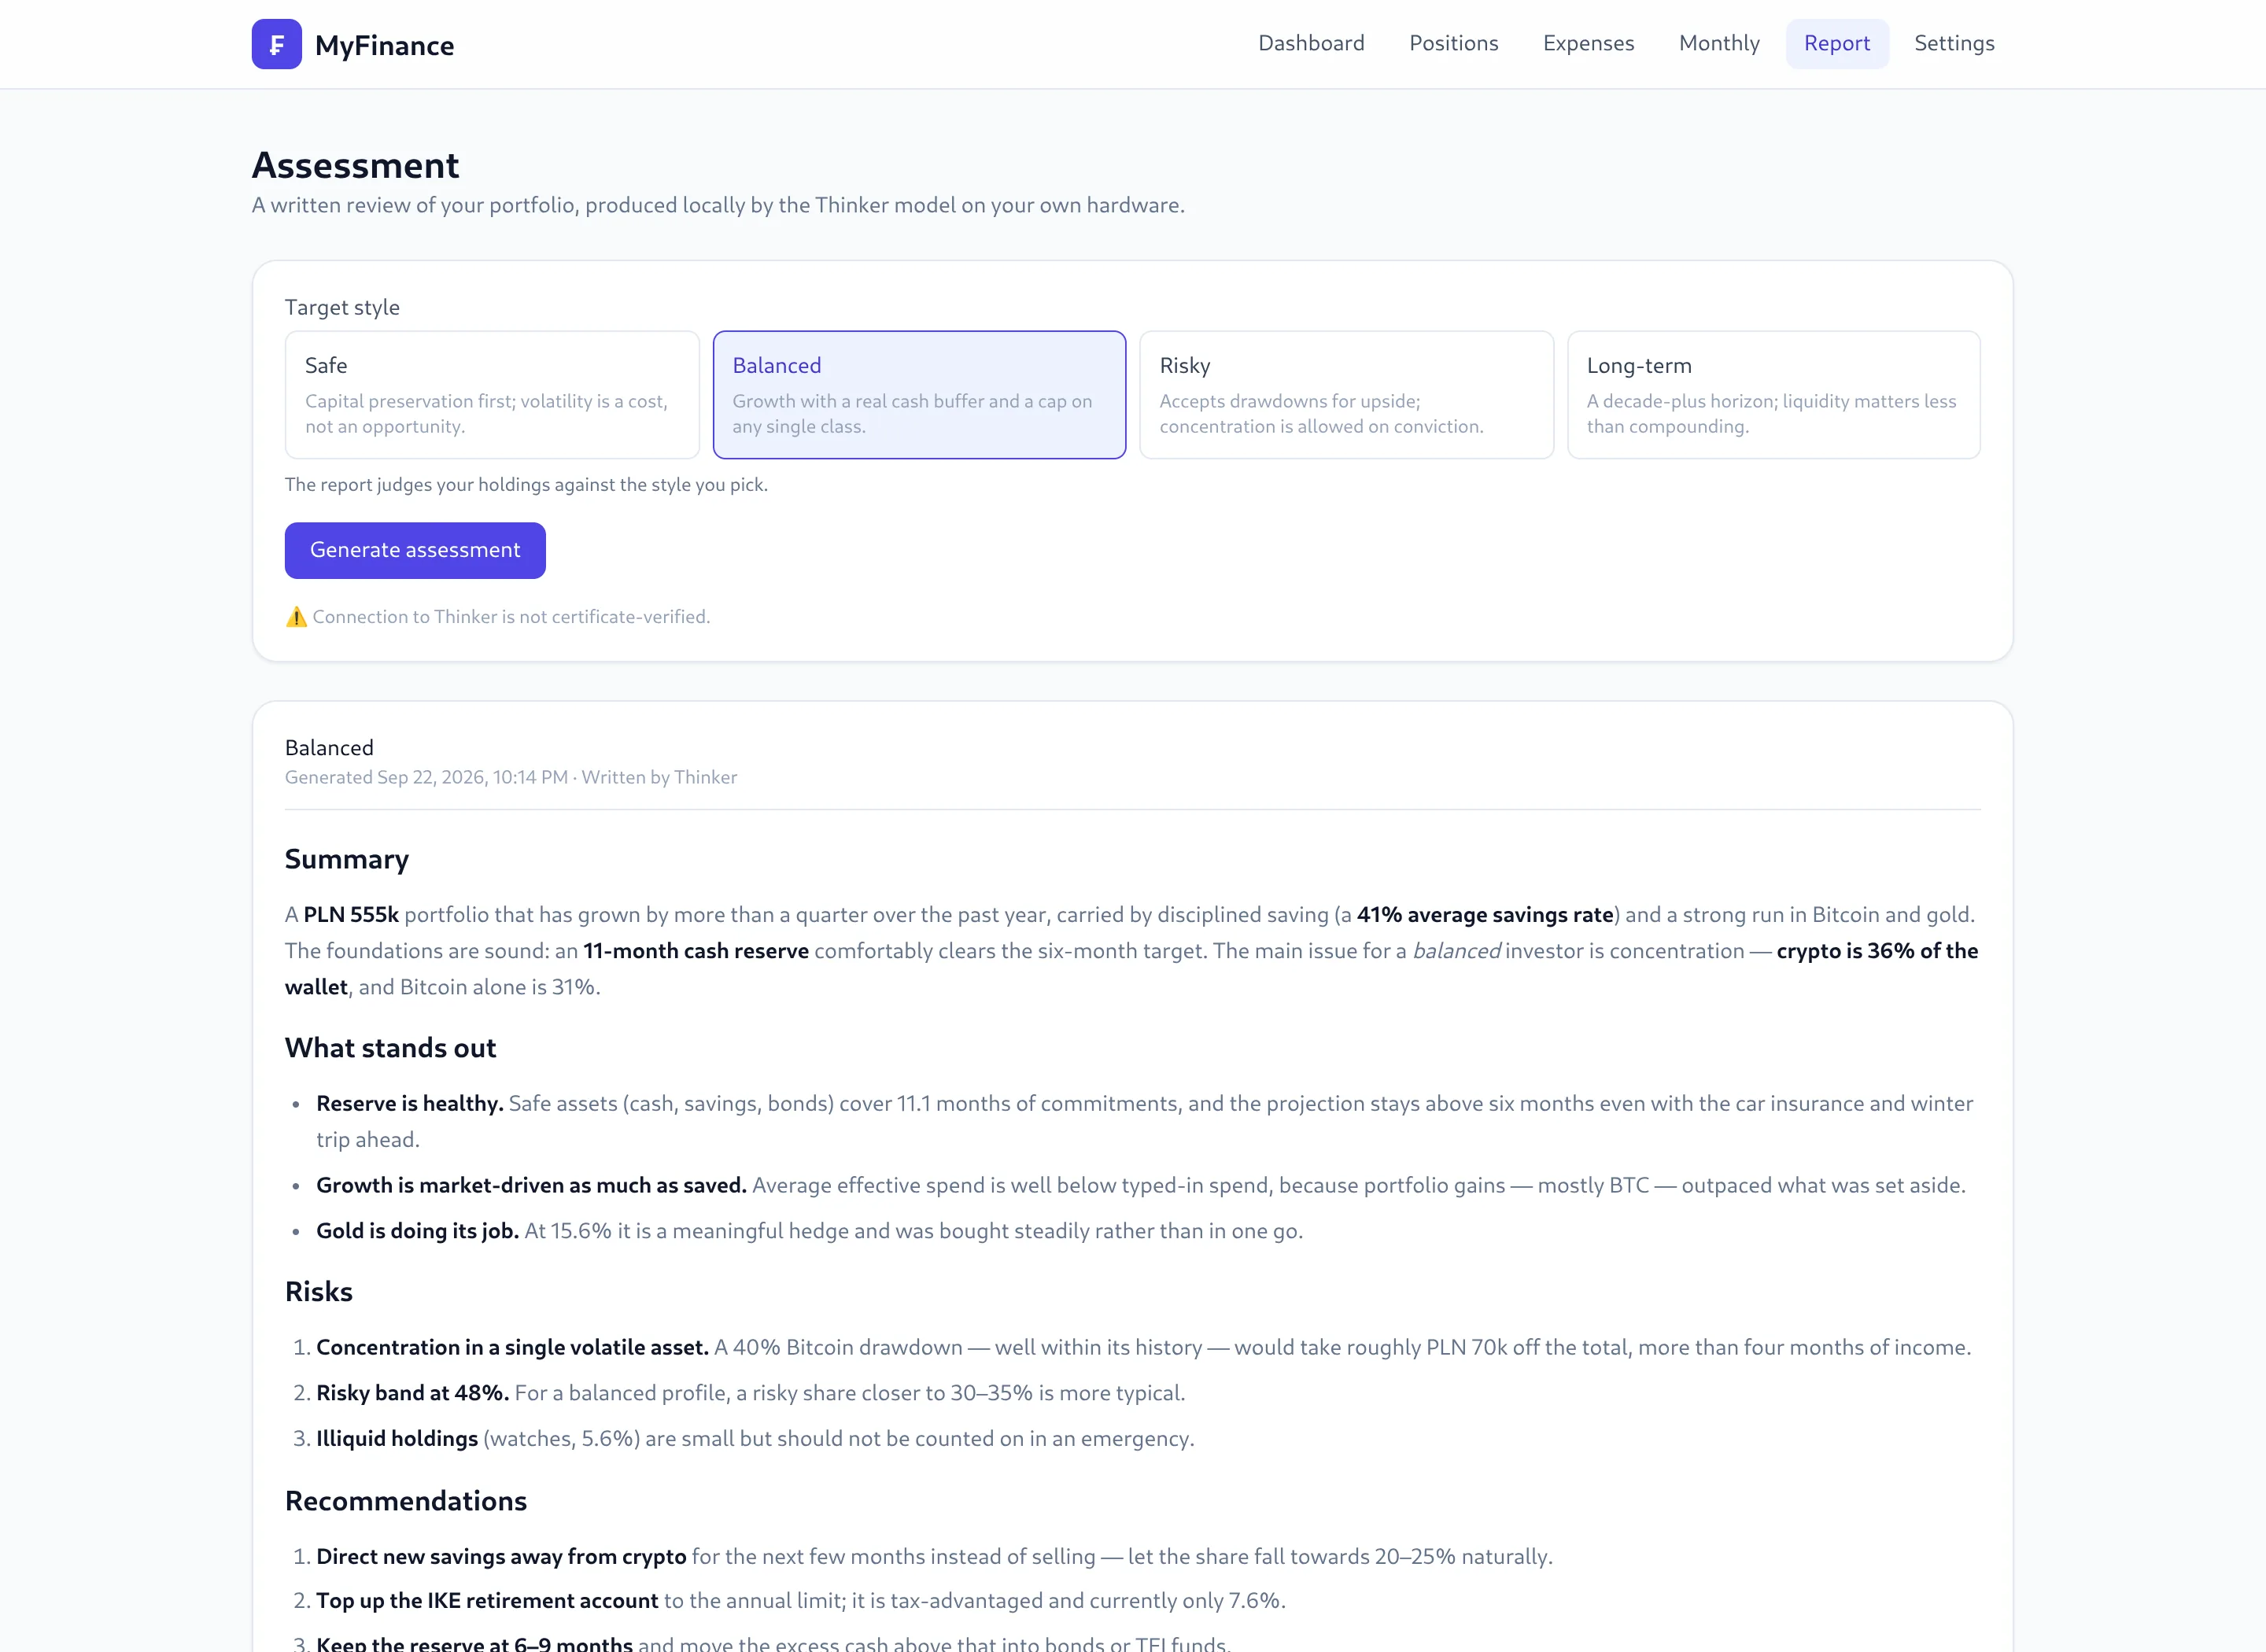
Assessment page with a style picker and a written review: summary, risks and recommendations
Sample report on demo data.

Four styles, four yardsticks

Safe

Capital preservation first. Expects at least six months of cover and is strict about concentration in stocks, crypto or any single holding.

Balanced

Real equity exposure plus a three-to-six-month buffer. No single class should dominate, and speculative holdings stay a modest slice.

Risky

Drawdowns and conviction bets are accepted, but it still insists on enough cash that a bad year never forces a sale at the bottom.

Long-term

A horizon of ten years or more. Idle cash and fees count as real costs, and each holding has to make sense a decade from now.

What the model sees

  • Every holding with its value and share, rolled up by class and by risk band
  • Monthly commitments by category
  • Twelve months of income, recorded spend and effective spend, plus your savings rate
  • The same numbers the dashboard shows

What you get back, and the rules it follows

  • Summary, What stands out, Risks and Recommendations, in that order
  • Every recommendation names a target: a percentage, an amount or months of cover
  • It uses only your figures, never invents a number, and says when something is missing
  • It never recommends specific tickers, funds or products. It's analysis, not financial advice.

Security

Security built in from the start

Entra ID sign-on

Authorization code with PKCE. There's no client secret in the code, the chart or the image.

Role-gated access

Only accounts assigned the app role get in, not everyone in the tenant.

Mutual TLS

The backend proves its identity with a certificate to PostgreSQL and to the model server.

Self-hosted

Your financial data stays on your own server or cluster. There's no third-party SaaS.

Dashboard in dark mode
Dark mode, with charts themed to match.
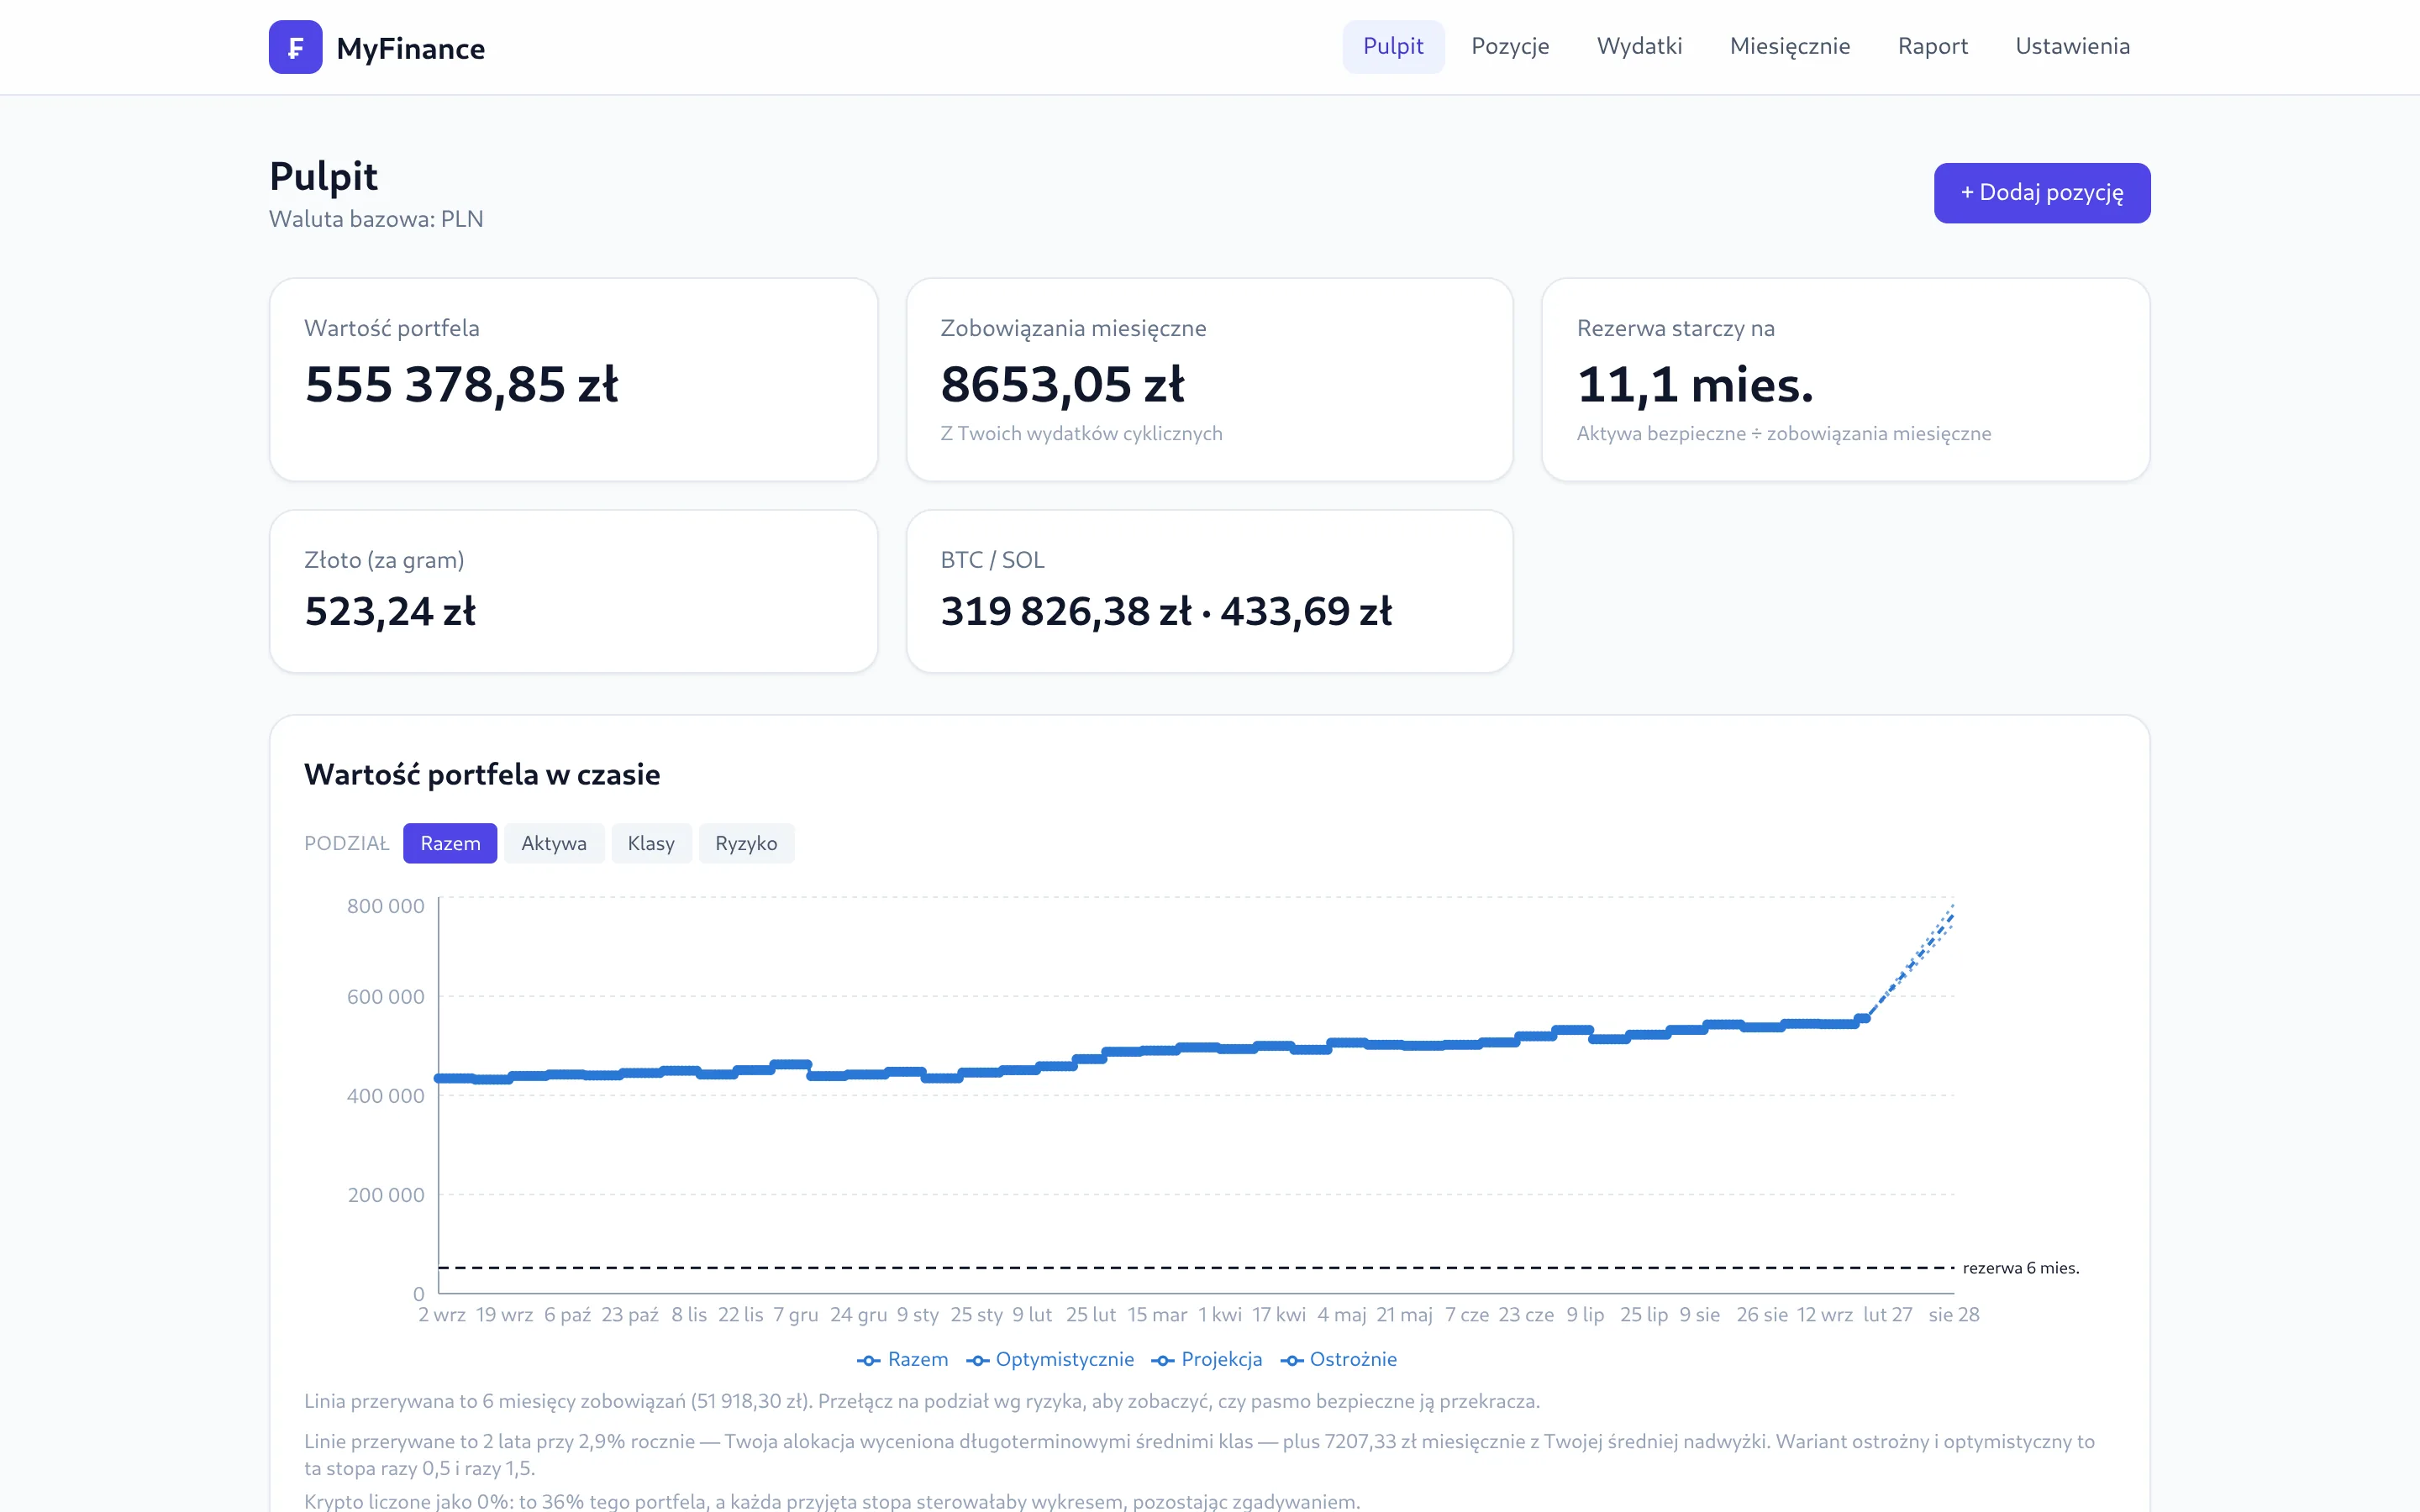
Dashboard in Polish
English and Polish throughout. Base currency can be PLN, EUR, USD or CHF.

Get started

Up and running with one command

$ git clone https://github.com/swiru95/MyFinance.git
$ cd MyFinance
$ docker compose up --build

# open http://localhost:3000

Sign-in and the AI review stay off until you configure them, so the app runs locally straight away.

FrontendNext.js 14, TypeScript, Tailwind, Recharts
BackendPython, FastAPI, SQLAlchemy
DatabaseSQLite, or PostgreSQL over mutual TLS
DeployDocker Compose, or a Helm chart on Kubernetes with images on GHCR
PricesPublic FX, gold and crypto APIs, with offline fallbacks
ModelsAny OpenAI-compatible server, such as llama-server

Know what you own. Know what you really spend.